This topic explains how to monitor a MySQL database by using Managed Service for Prometheus.
Before you begin
You have the connection details for your MySQL instance, including its address, port, username, and password.
Integrate MySQL monitoring
-
Log on to the ARMS console.
-
In the left navigation pane, click Access Center.
-
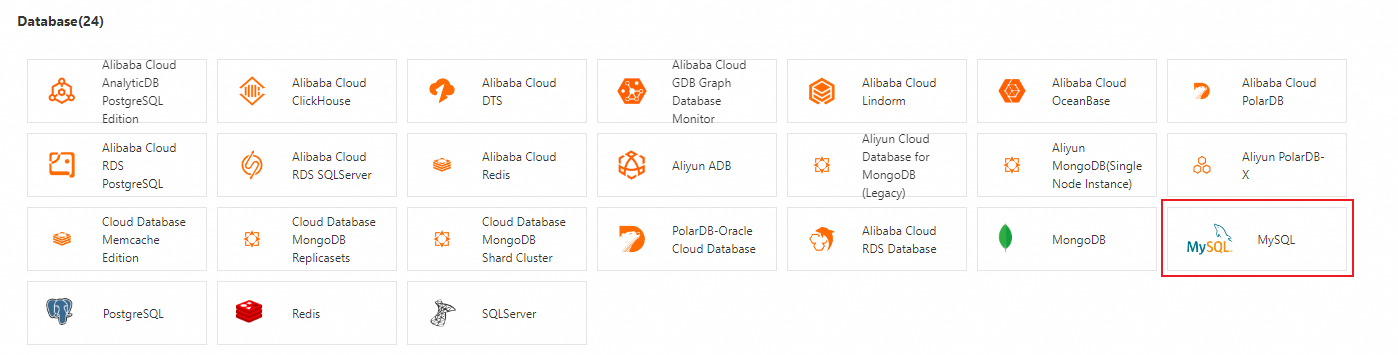
On the Access Center page, in the Database section, click MySQL.
-
In the MySQL panel, on the Start Integration tab, configure the integration parameters and click OK.
Parameter
Description
Select the environment type.
You can integrate MySQL instances from the following three environment types:
-
Kubernetes environment
-
ECS (VPC)
-
Cloud Services
Select Cluster
Select the target cluster.
Select ECS (VPC)
Select the target ECS instance.
Select Region for Storage
If you set Select the environment type. to Cloud Services, you must select the region where data is stored.
MySQL Address
The endpoint of the MySQL instance.
NoteThis integration supports MySQL instances deployed in Container Service for Kubernetes (ACK), ECS, or ApsaraDB RDS.
MySQL Service Port
The port number of the MySQL instance. For example, 3306.
MySQL Username and MySQL Password
The username and password for the MySQL instance.
ImportantTo prevent security risks such as data leaks, we recommend that you do not use an administrator account. Create a dedicated MySQL user for the mysqld_exporter with the minimum required permissions. For more information, see Create a MySQL user for Managed Service for Prometheus.
-
Configure alert rules for MySQL
-
Log on to the ARMS console.
-
In the left navigation pane, choose .
-
At the top of the page, select the target region, and then click the name of the target cluster.
-
In the left navigation pane, click Alert Rules to view the Prometheus alert rules for MySQL.
Managed Service for Prometheus provides several default alert rules for key MySQL metrics. You can also create new alert rules based on your business needs. For more information about how to create a Prometheus alert rule, see Create a Prometheus alert rule.
Note-
For more information about key MySQL metrics, see the Key metrics section.
-
For details about the preset alert rules for key MySQL metrics in Managed Service for Prometheus, see the Build an observability and alerting system with Prometheus section below.
-
View the MySQL monitoring dashboard
You can use the monitoring dashboard to view data on availability, database queries, network traffic, connections, and memory. Follow these steps:
-
Log on to the ARMS console.
-
In the left navigation pane, click Data Import Management.
-
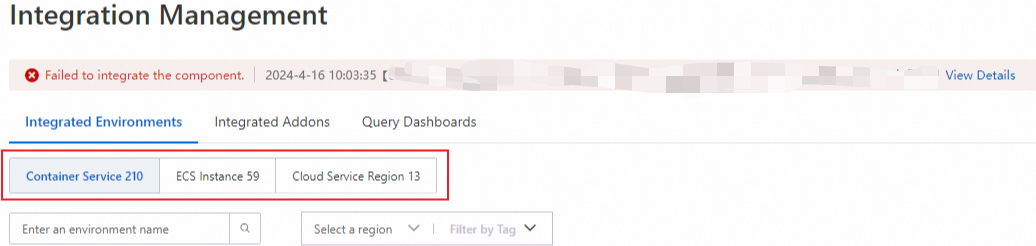
On the Data Import Management page, go to the Integrated Environments tab. Select the target environment and click its name to go to the details page.
-
On the Component Management tab, in the Component Type section, click MySQL, and then click Dashboards to view all dashboard names.
-
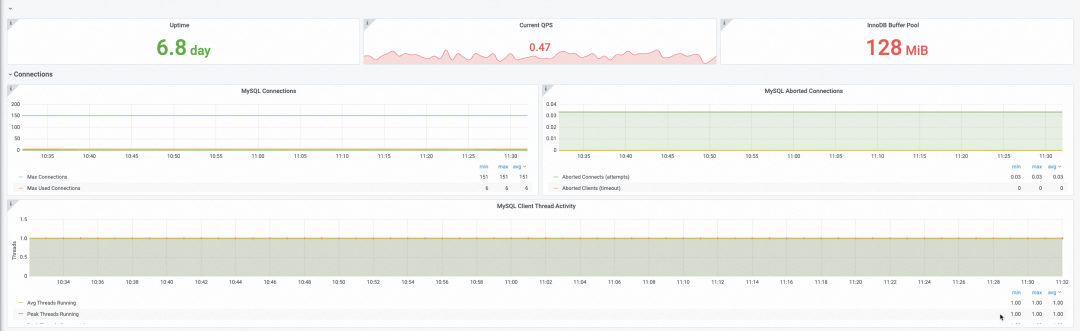
Click a dashboard name to open its Grafana dashboard.
-
Availability, QPS, and database connections.
-
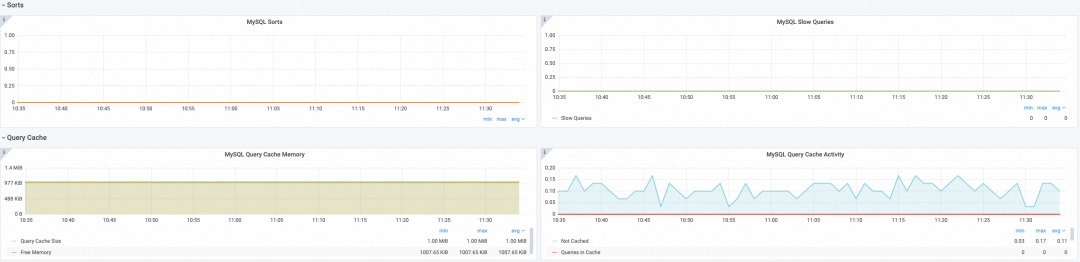
Database queries.
-
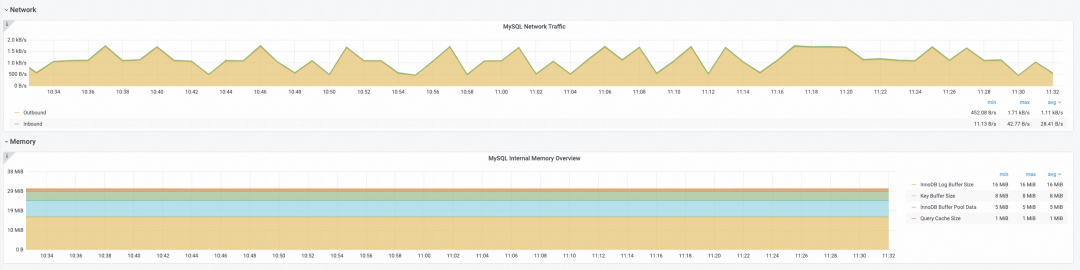
Traffic and memory usage.
-
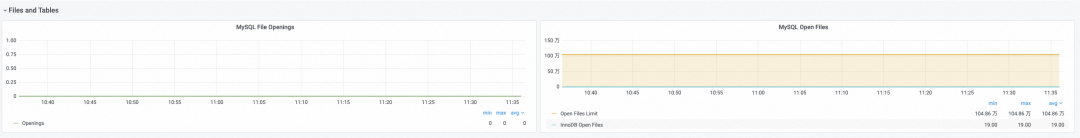
File monitoring data.
-
Key metrics
|
Type |
Metric name |
Description |
|
Availability |
mysql_up |
A value of 1 indicates the instance is up; 0 indicates it is down. |
|
mysql_global_status_uptime |
The uptime of the database. You can use this metric to create an alert that triggers if a MySQL instance has been running for less than 30 minutes. |
|
|
Database connection |
mysql_global_status_connection_errors_total |
Tracks the count and types of connection errors. |
|
mysql_global_status_threads_connected |
The number of threads currently connected to the MySQL instance. |
|
|
mysql_global_status_threads_running |
The number of threads that are actively processing requests. |
|
|
mysql_global_status_max_used_connections |
The historical maximum number of simultaneous connections used by the MySQL instance. |
|
|
mysql_global_variables_max_connections |
The configured maximum number of simultaneous connections for the MySQL instance. New connection requests are rejected when this limit is reached. |
|
|
mysql_global_status_aborted_connects |
The number of failed attempts to connect to the MySQL server. |
|
|
mysql_global_status_aborted_clients |
The number of client connections that were aborted, for example, due to timeouts. |
|
|
Query |
mysql_global_status_slow_queries |
The total number of slow queries executed by the MySQL instance. |
|
mysql_global_status_queries |
The queries per second (QPS) of the MySQL instance. |
|
|
Traffic |
mysql_global_status_bytes_received |
Inbound traffic in bytes. |
|
mysql_global_status_bytes_sent |
Outbound traffic in bytes. |
|
|
File |
mysql_global_status_opened_files |
A counter for the number of files that have been opened. |
|
mysql_global_status_open_files |
The number of files that are currently open. |
|
|
mysql_global_variables_open_files_limit |
The configured limit for the number of open files. |
|
|
mysql_global_status_innodb_num_open_files |
The number of files currently held open by the InnoDB storage engine. |
Observability and alerting with Prometheus
Setting up a self-managed Prometheus system is complex. It requires you to deploy an exporter, provide MySQL connection details, configure service discovery, and build dashboards. Managed Service for Prometheus simplifies this process by integrating the MySQL Exporter with a single click. It provides out-of-the-box monitoring dashboards and alert rules through a web UI, significantly reducing the configuration workload.
Based on best practices, Managed Service for Prometheus provides preset templates for common MySQL alert rules. This helps operations teams quickly set up metric dashboards and an alerting system. The preset MySQL alert rules are as follows:
-
MySQL downtime: A value of 0 indicates the database is down, and a value of 1 indicates it is running. You can use the
${instance}variable to target a specific instance in the alert.mysql_up{${instance}} != 1 -
Slow queries: Use this metric to identify SQL statements that require optimization.
rate(mysql_global_status_slow_queries{${instance}}[5m]) > 0 -
Connection errors: Connection errors are a major type of database error. When this alert is triggered by using the alert rule provided by Managed Service for Prometheus, you receive a notification that includes information such as the error type and query count.
rate(mysql_global_status_connection_errors_total{${instance}}[5m]) > 0 -
MySQL Connection Usage: Connection errors are often caused by an insufficient number of available connections. You can use this metric to investigate the issue.
100 * mysql_global_status_threads_connected{${instance}}
      / mysql_global_variables_max_connections{${instance}} > 90
When connection usage reaches the configured threshold, the MySQL instance rejects new connections. To resolve this, increase the maximum number of connections. However, before increasing the limit, check the number of files the system can open by using the following expression:
mysql_global_variables_open_files_limit - mysql_global_variables_innodb_open_files -
InnoDB log wait time: The rate at which threads have to wait for the InnoDB log.
rate(mysql_global_status_innodb_log_waits{${instance}}[5m])