Alibaba Cloud Managed Service for Prometheus allows you to install and configure the Node Exporter for Prometheus instances. Managed Service for Prometheus also provides out-of-the-box dashboards that you can use to monitor your applications.
Limits
The Node Exporter can be installed with a few clicks on Prometheus instances for Elastic Compute Service (ECS) that reside in Alibaba Cloud regions in the Chinese mainland. In other regions, you need to manually install the Node Exporter.
Go to the Integration Center page
Procedure 1: Integration Center of Managed Service for Prometheus
- Log on to the ARMS console.
- In the left-side navigation pane, choose .
- Click the name of the Prometheus instance instance that you want to manage to go to the Integration Center page.
Go to the Integration Center page of ARMS
- Log on to the Application Real-Time Monitoring Service (ARMS) console.
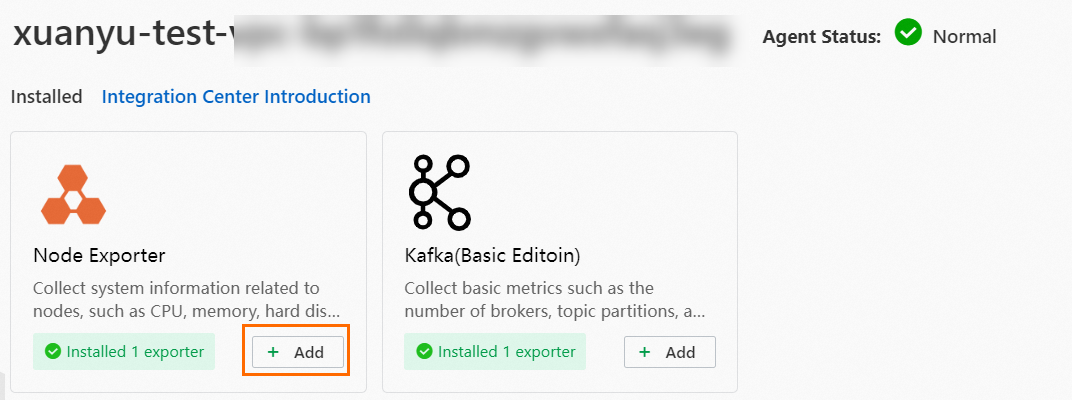
- In the left-side navigation pane, click Integration Center. In the Application Components section, find the Node Exporter card and click Add. In the panel that appears, follow the instructions to install and configure the Node Exporter.
Install and configure the Node Exporter
In this example, the Node Exporter is installed and configured on the Integration Center page of the Managed Service for Prometheus console.
- Install or add the Node Exporter.
- If you install the Node Exporter for the first time, perform the following operations:
On the Integration Center page, find the Node Exporter card in the uninstalled section and click Install.
- If you have already installed the Node Exporter, perform the following operations:On the Integration Center page, find the Node Exporter card in the Installed section and click Add.
- If you install the Node Exporter for the first time, perform the following operations:
- In the STEP1 section of the panel that appears, select one or more ECS instances and click Install. Note
- You can select multiple ECS instances at a time.
- You can filter ECS instances by selecting tags from the Tag drop-down list next to the search box.
- For an ECS instance, you can check whether the Node Exporter is installed based on the following states:
- Not Installed: No Node Exporter is installed on the ECS instance.
- Installed: The Node Exporter is installed on the ECS instance.
If the installation fails due to reasons such as a port conflict, a message appears to inform you of the ECS instances on which the Node Exporter fails to be installed and the cause of the failure.
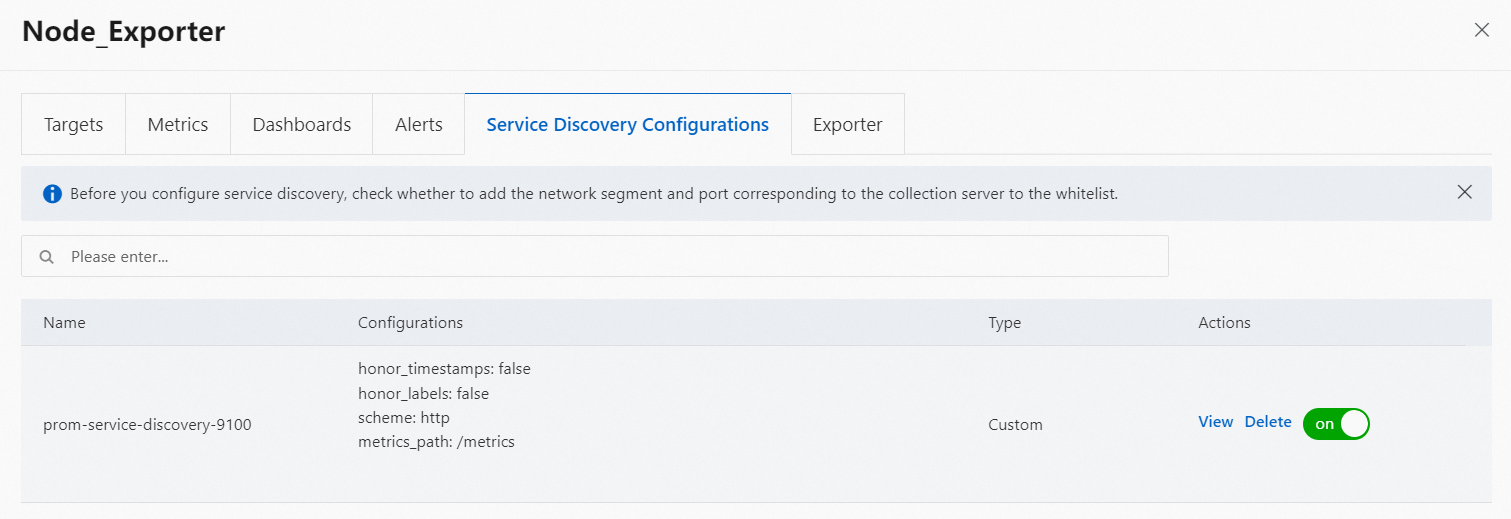
Advanced settings: By default, when you install the Node Exporter on an ECS instance, Managed Service for Prometheus provides service discovery configurations. The default port number is 9100. If you install the Node Exporter on an ECS instance on which the open source Node Exporter is already installed, a message appears to inform you that the port is used. To resolve this issue, we recommend that you uninstall the open source Node Exporter and try to install the Node Exporter again. Alternatively, you can modify the port number for service discovery in the Advanced Settings section and try to install the Node Exporter again.
Parameter Description Port Number The port number for service discovery. Default value: 9100. Collection Path The collection path used for service discovery. Default value: /metrics.Collection Interval (Seconds) The interval at which statistics are collected. Default value: 15. Unit: seconds. After you configure the parameters, click OK.
View the status of the Node Exporter
After the Node Exporter is installed and configured, click the Node Exporter card in the Installed section of the Integration Center page. In the panel that appears, click the Dashboards tab to view the summary and details of monitoring data of ECS instances.
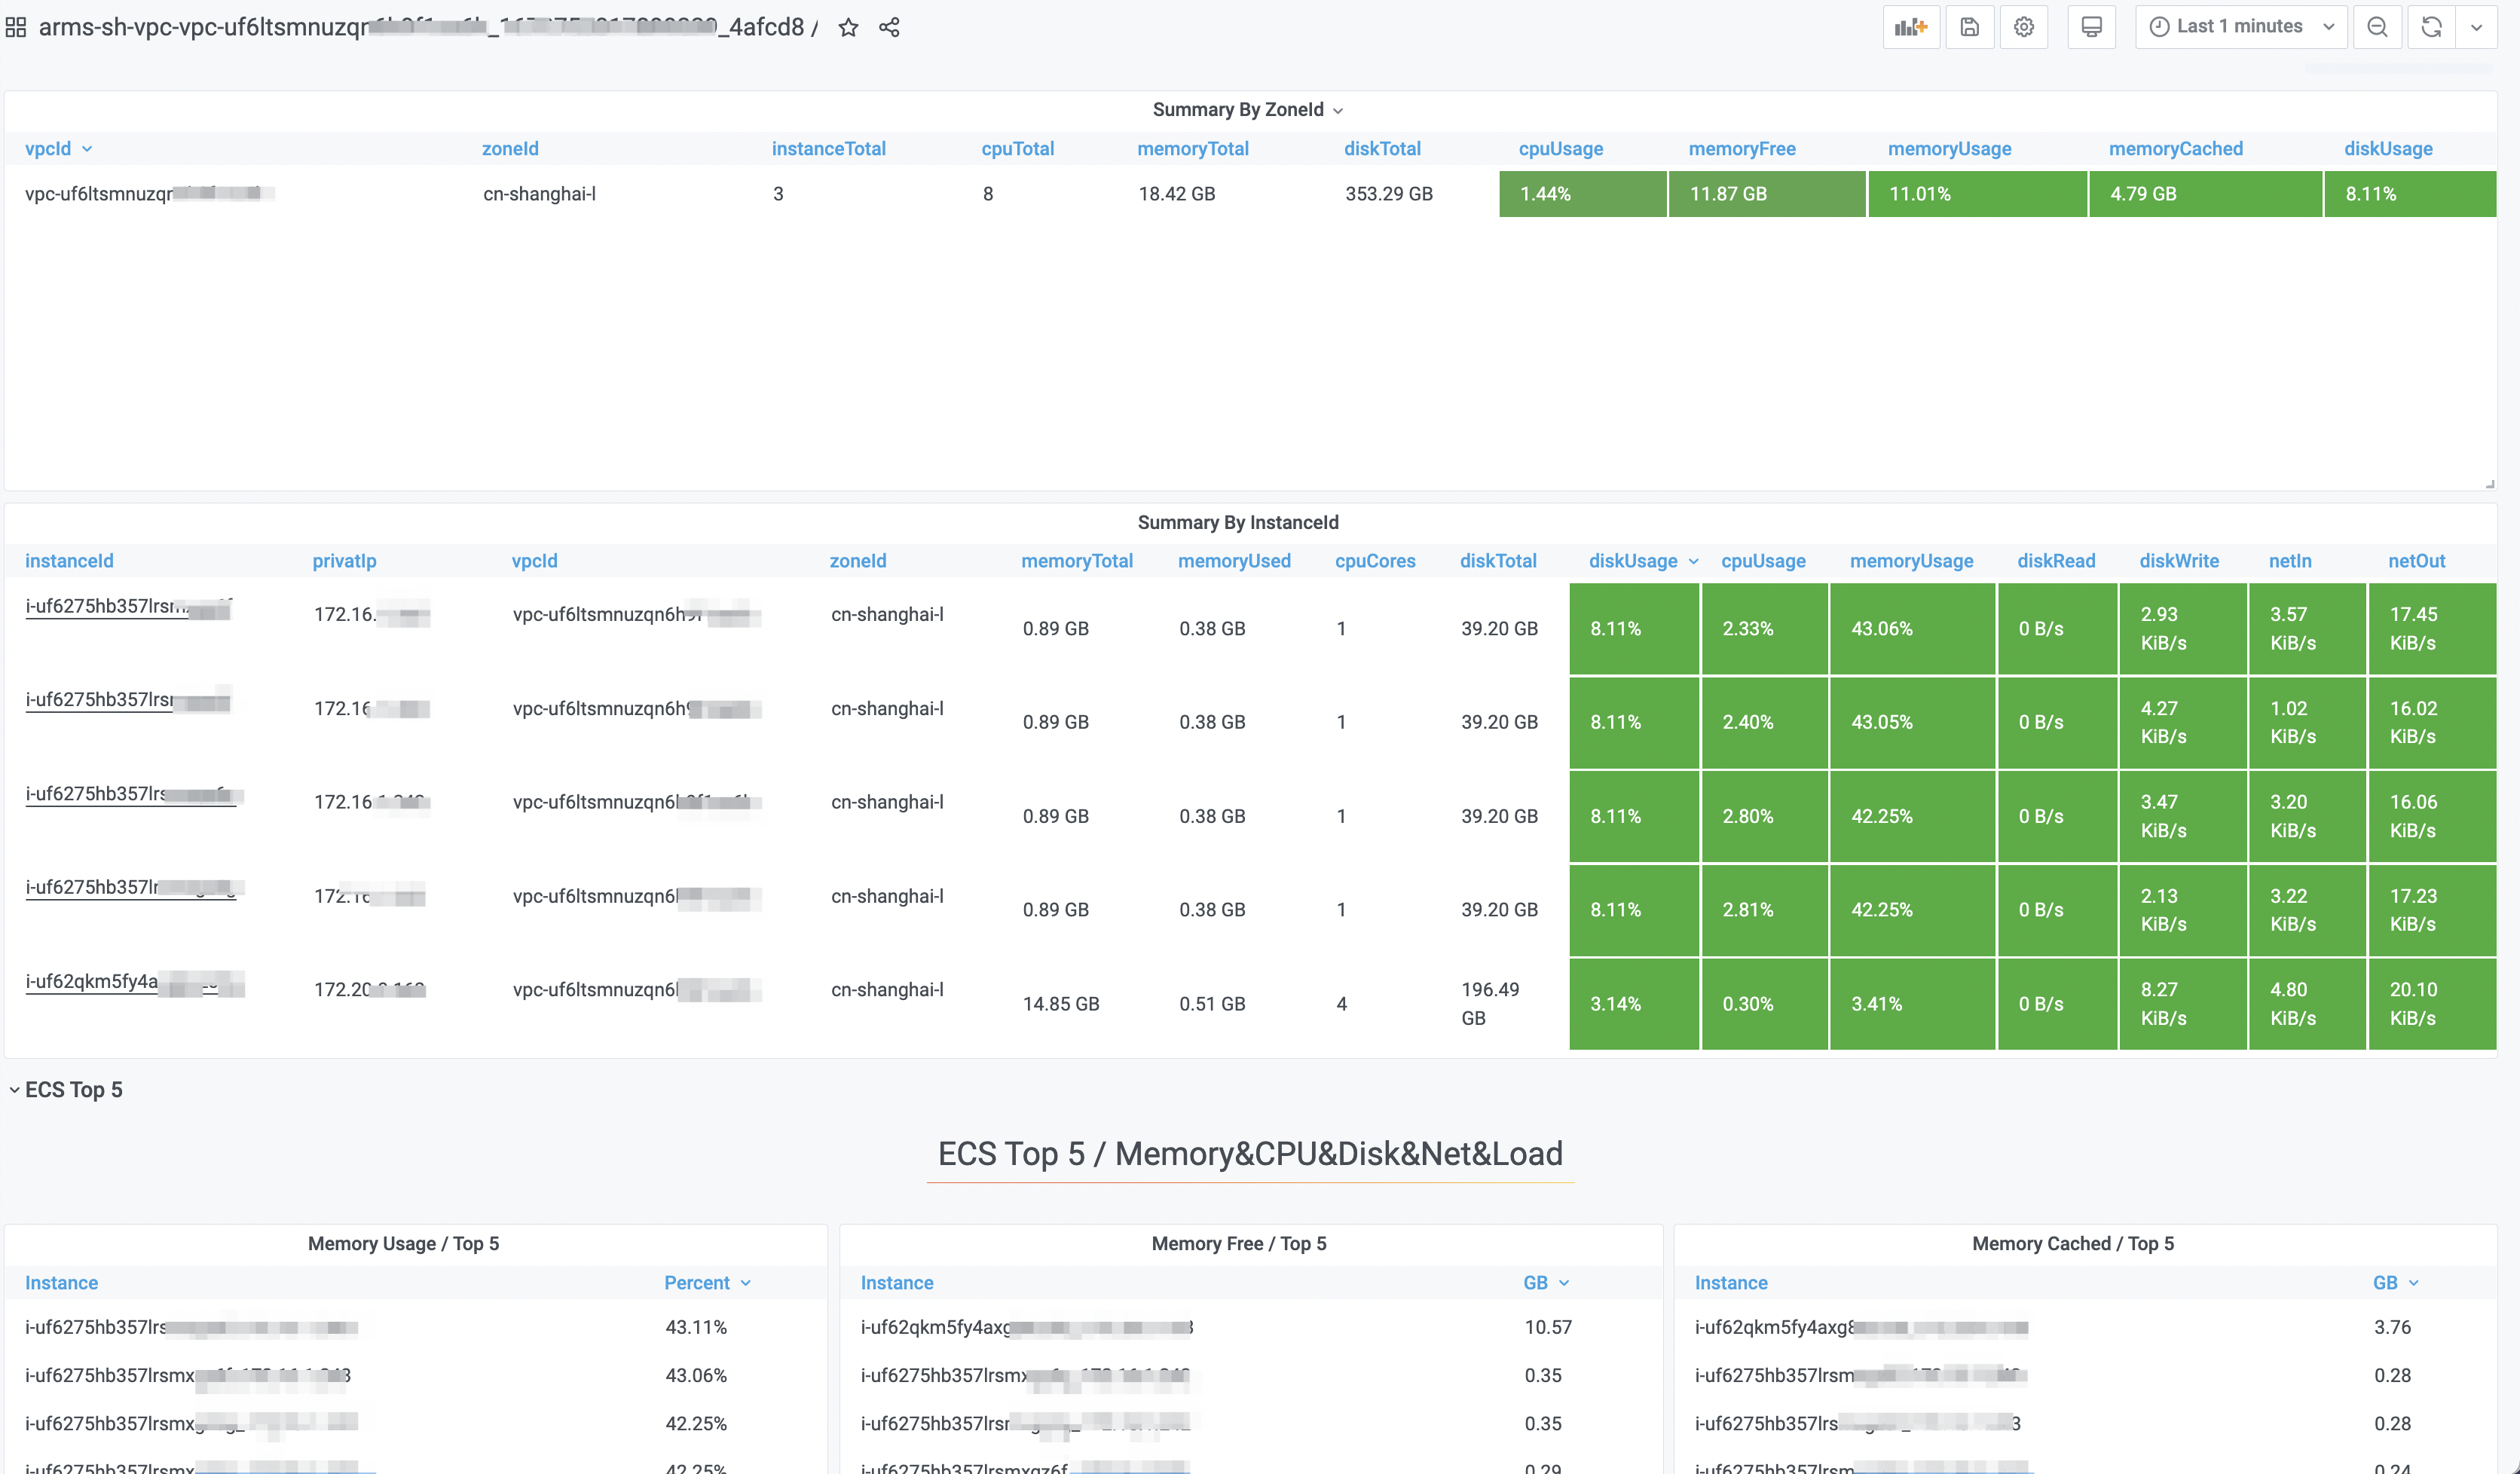
ECS Summary dashboard
The following figure shows the summary of system metrics of ECS instances on the ECS Summary dashboard.
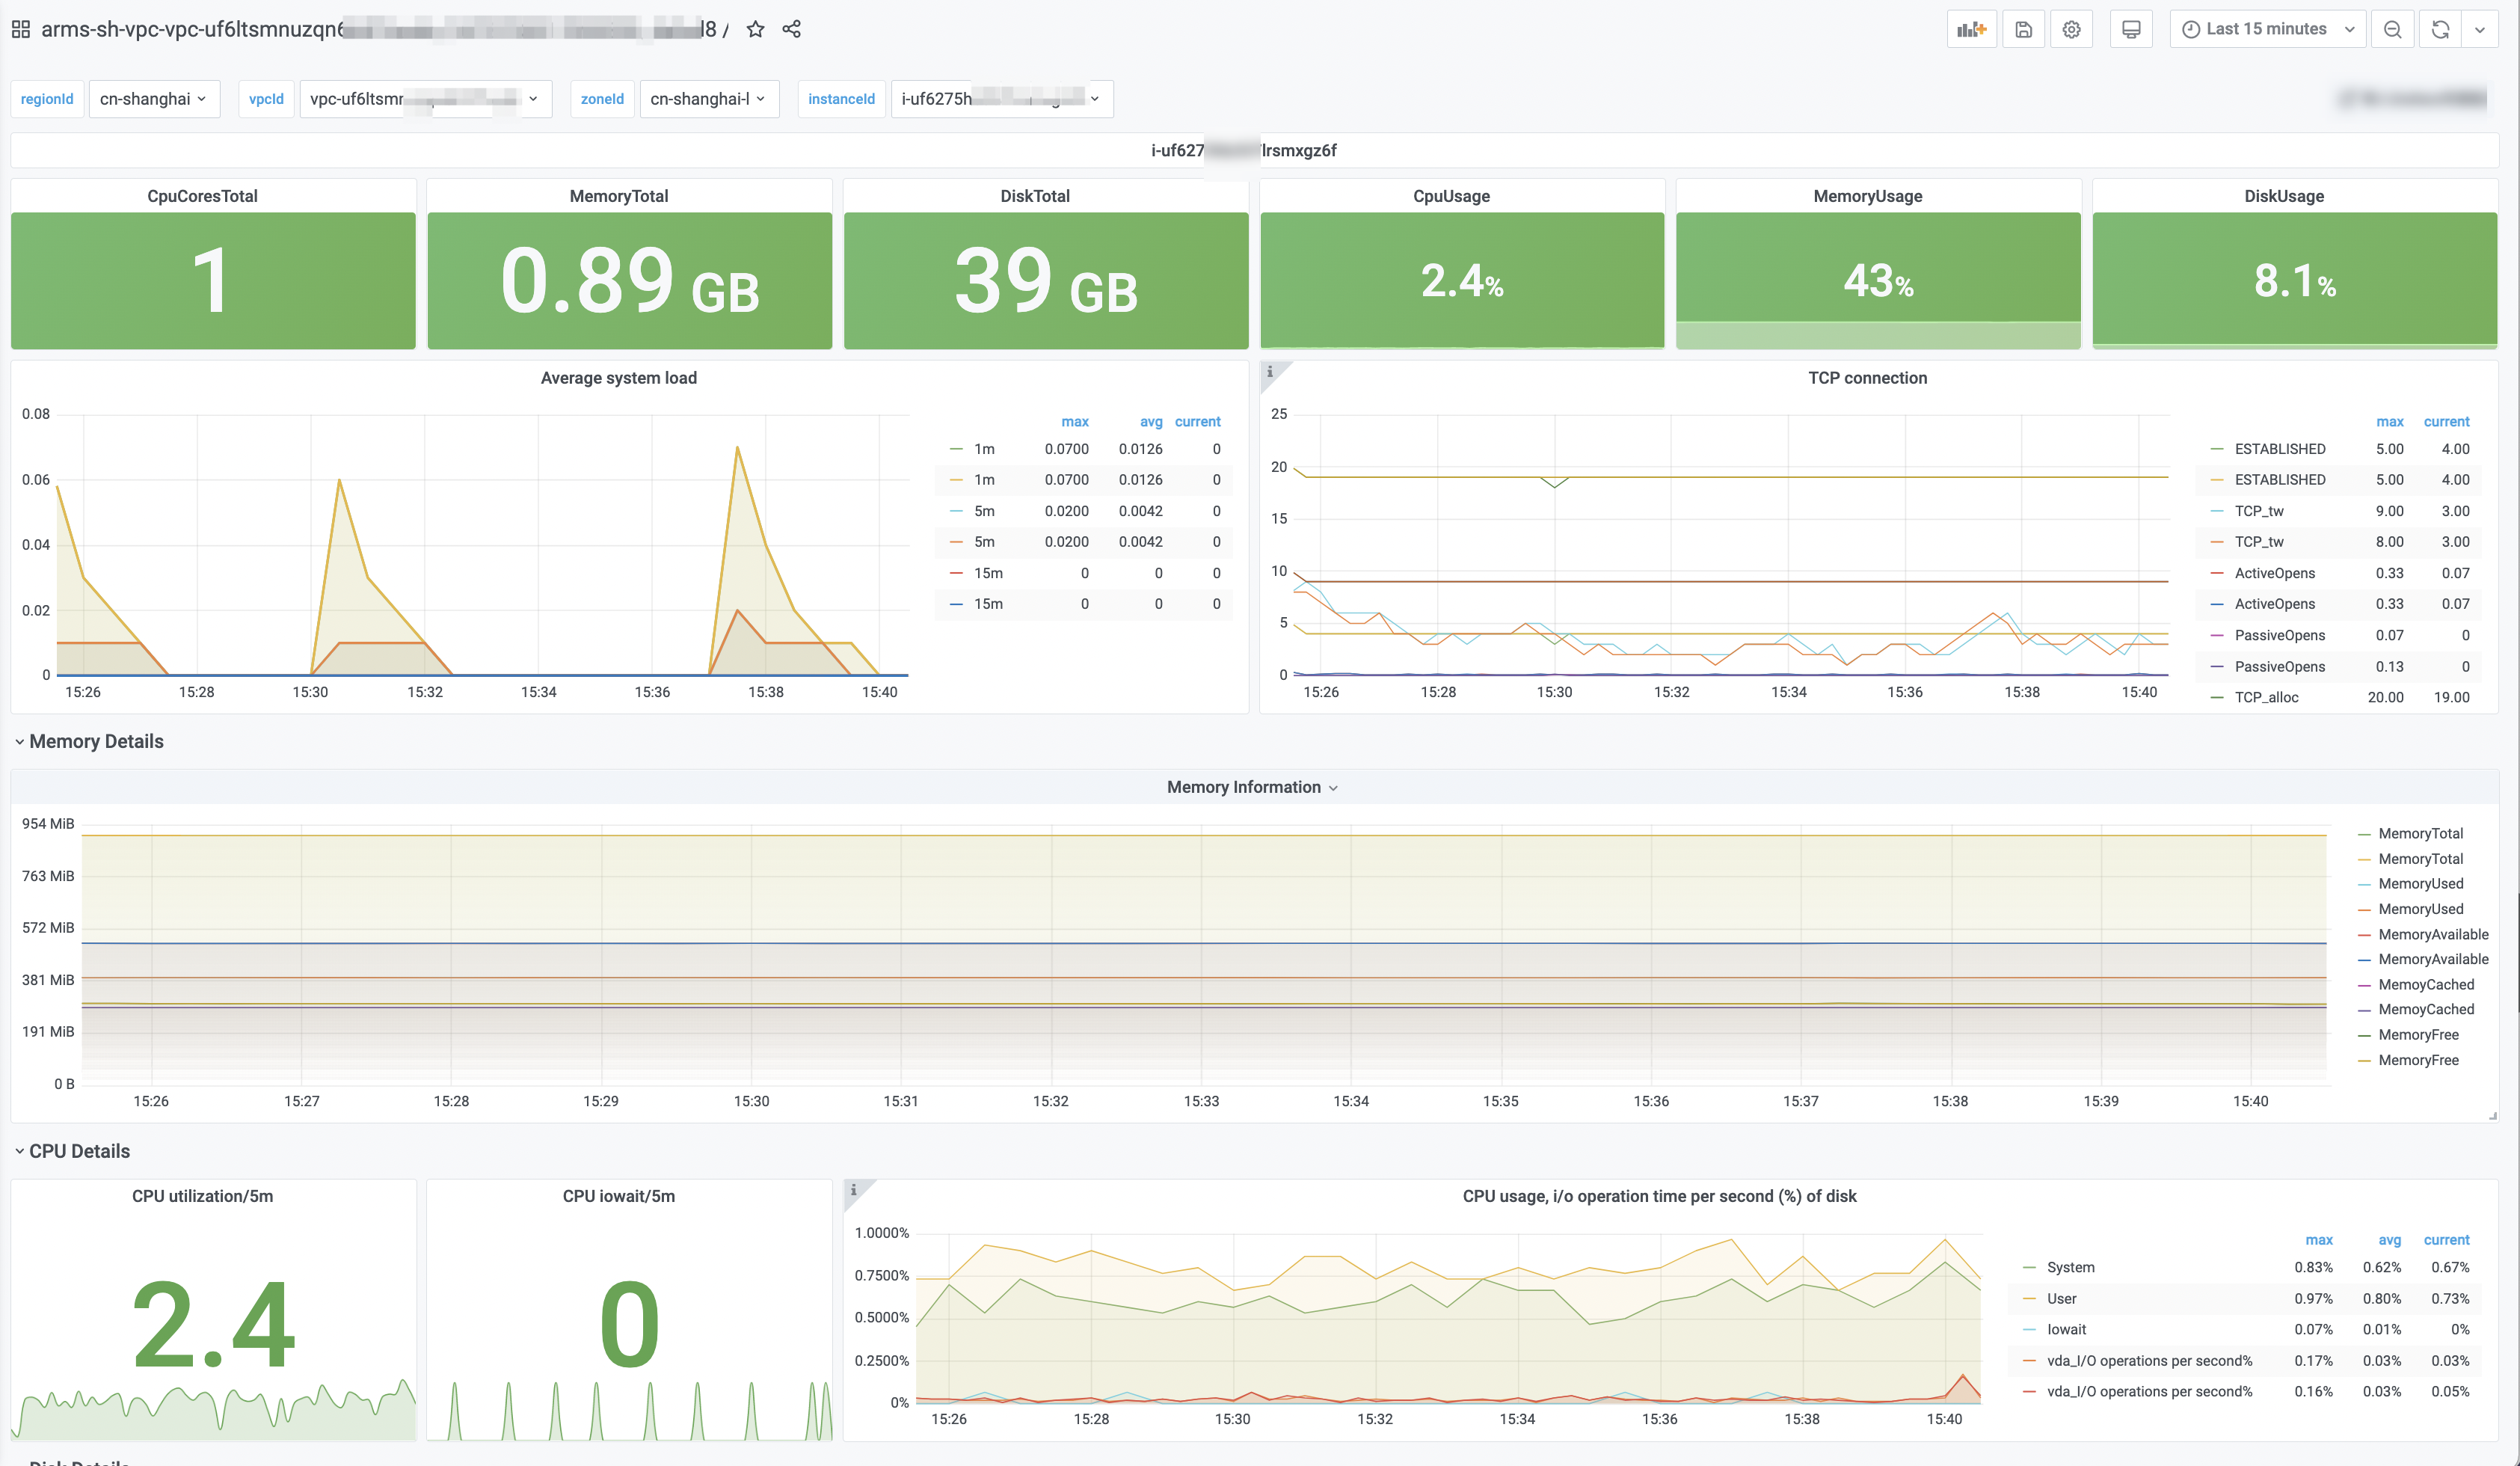
ECS Details dashboard
The following figure shows the detailed metrics of an ECS instance on the ECS Details dashboard.