Alibaba Cloud Managed Service for Prometheus allows you to install and configure Knative exporters. Managed Service for Prometheus also provides out-of-the-box dashboards that you can use to monitor your applications. This topic describes how to install and configure a Knative exporter.
Prerequisites
A Container Service for Kubernetes (ACK) or ACK Serverless cluster is monitored in Managed Service for Prometheus. For more information, see Enable Managed Service for Prometheus.
Knative is deployed. For more information, see Deploy Knative.
Background information
Knative is a Kubernetes-based serverless framework. The main objective of Knative is to develop a cloud-native and cross-platform orchestration standard for serverless applications. It helps you deploy and manage modern serverless workloads and build an enterprise-level serverless container platform.
Since the early versions of Knative were released, ACK has been keeping up with the iterations of Knative community features and developing Knative integrations. ACK has been integrated with the messaging, storage, network, and monitoring services of Alibaba Cloud to provide Knative capabilities for production environments.
Limits
You can install the component only for Prometheus for Container Service instances.
Procedures
Entry point 1
- Log on to the ARMS console.
- In the left-side navigation pane, choose .
- Click the name of the Prometheus instance instance that you want to manage to go to the Integration Center page.
Procedure 2:Integration Center
Log on to the Application Real-Time Monitoring Service (ARMS) console.
In the left-side navigation pane, click Integration Center. In the Application Components section, find the Knative exporter and click Add. In the panel that appears, install and configure a Knative exporter as prompted.
Install and configure Knative
This section describes how to configure a Knative exporter on the Integration Center page. Perform the following steps:
Install a Knative exporter
If you install a Knative exporter for the first time, perform the following operation:
In the Not Installed section of the Integration Center page, find the Knative exporter and click Install.
If you have installed a Knative exporter, you need to add the exporter again:
In the Installed section of the Integration Center page, find the Knative exporter and click Add.
On the Configuration tab in the STEP2 section, configure the parameters and click OK.
Parameter
Description
Exporter Name
The unique name of the Knative exporter.
Metrics scrape interval (seconds)
The interval at which monitoring data is collected.
NoteYou can view the monitoring metrics on the Metrics tab in the STEP2 section.
The installed components are displayed in the Installed section of the Integration Center page. Click the component. In the panel that appears, you can view information such as targets, metrics, dashboard, alerts, service discovery configurations, and exporters. For more information, see Integration center.
View the data of a Knative dashboard
In the Installed section of the Integration Center page, click the Knative exporter to view the details of its dashboard.
Knative monitoring data provided by Managed Service for Prometheus includes the number of requests, number of pods, response latency, and number of concurrent requests.
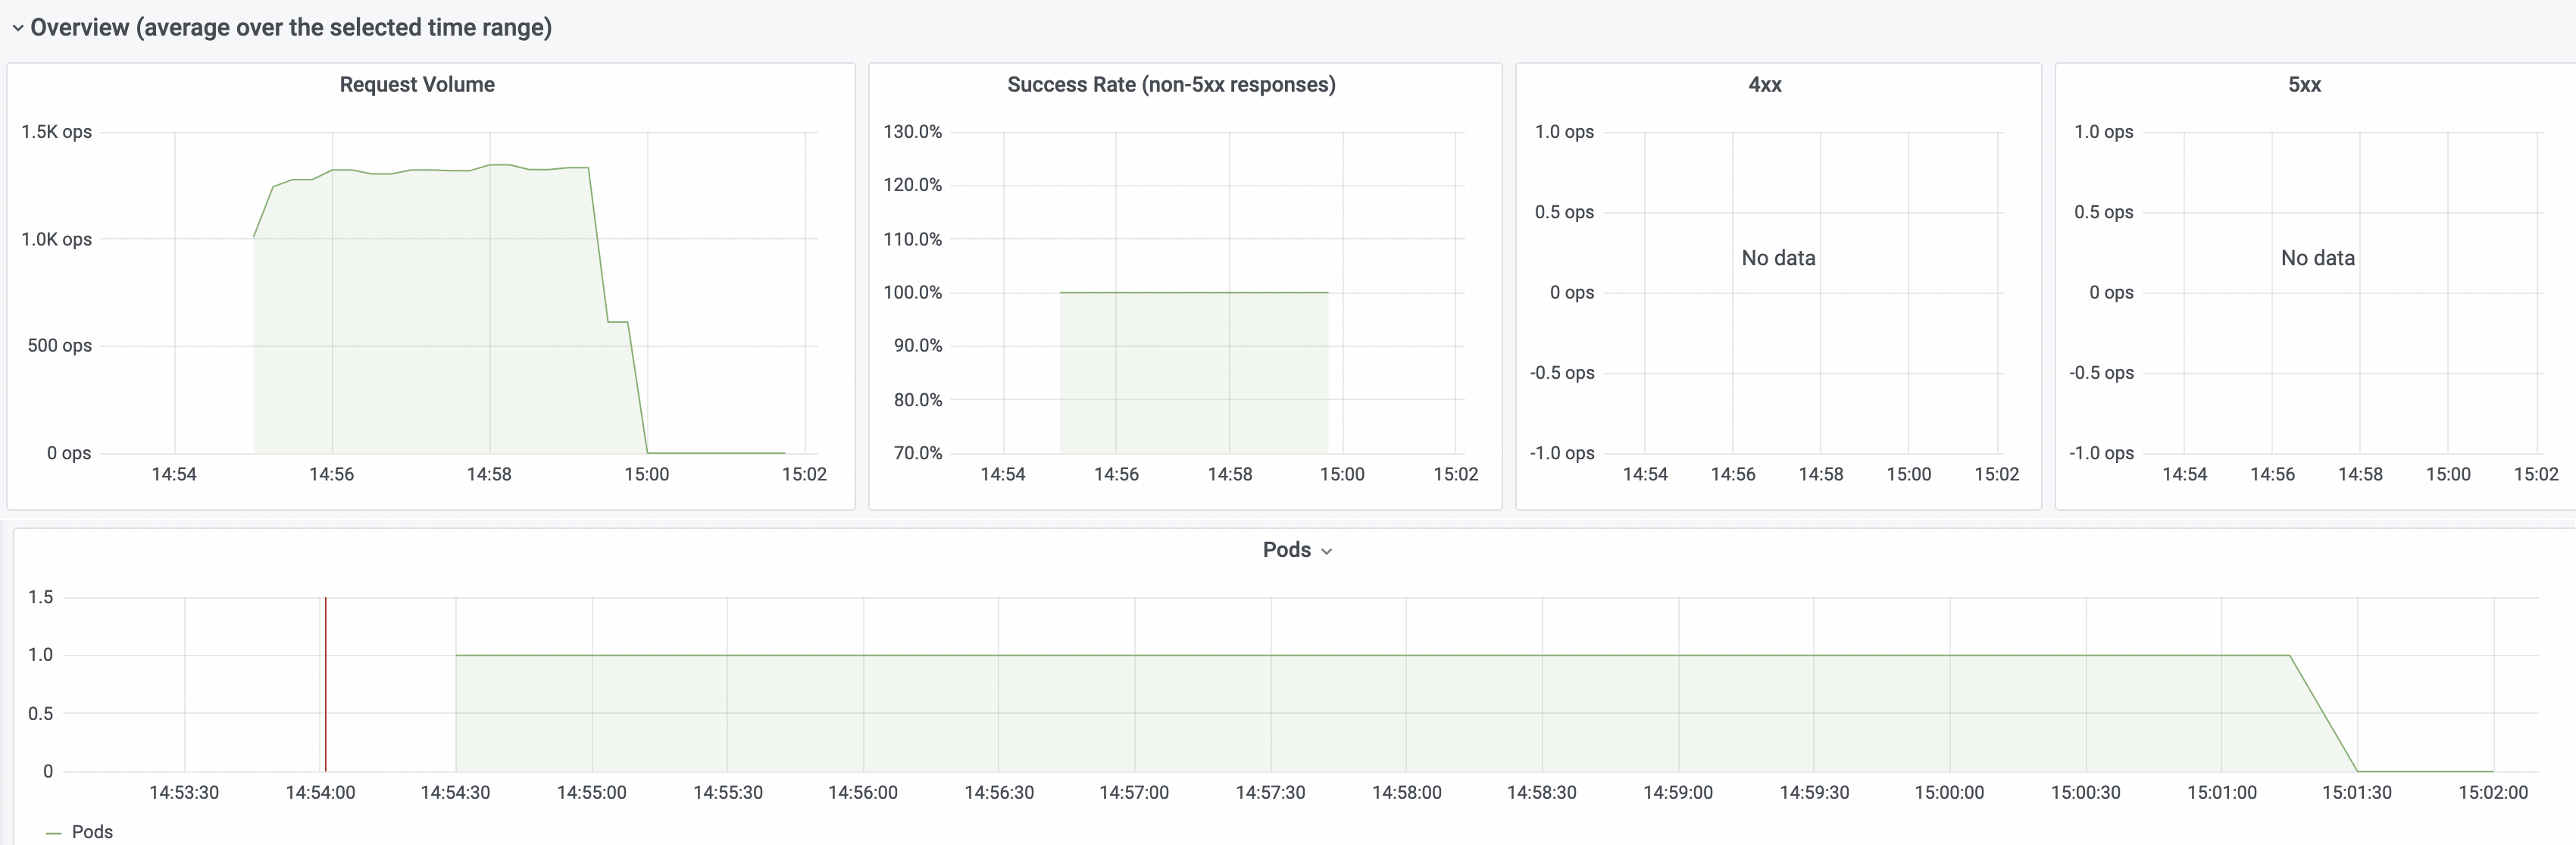
Expand the Overview section. You can view the number of requests, success rate of requests, 4xx errors (client errors), 5xx errors (server errors), and pod scaling trend.
NoteThe vertical axis indicates the number of requests processed per second. Unit: ops/sec.
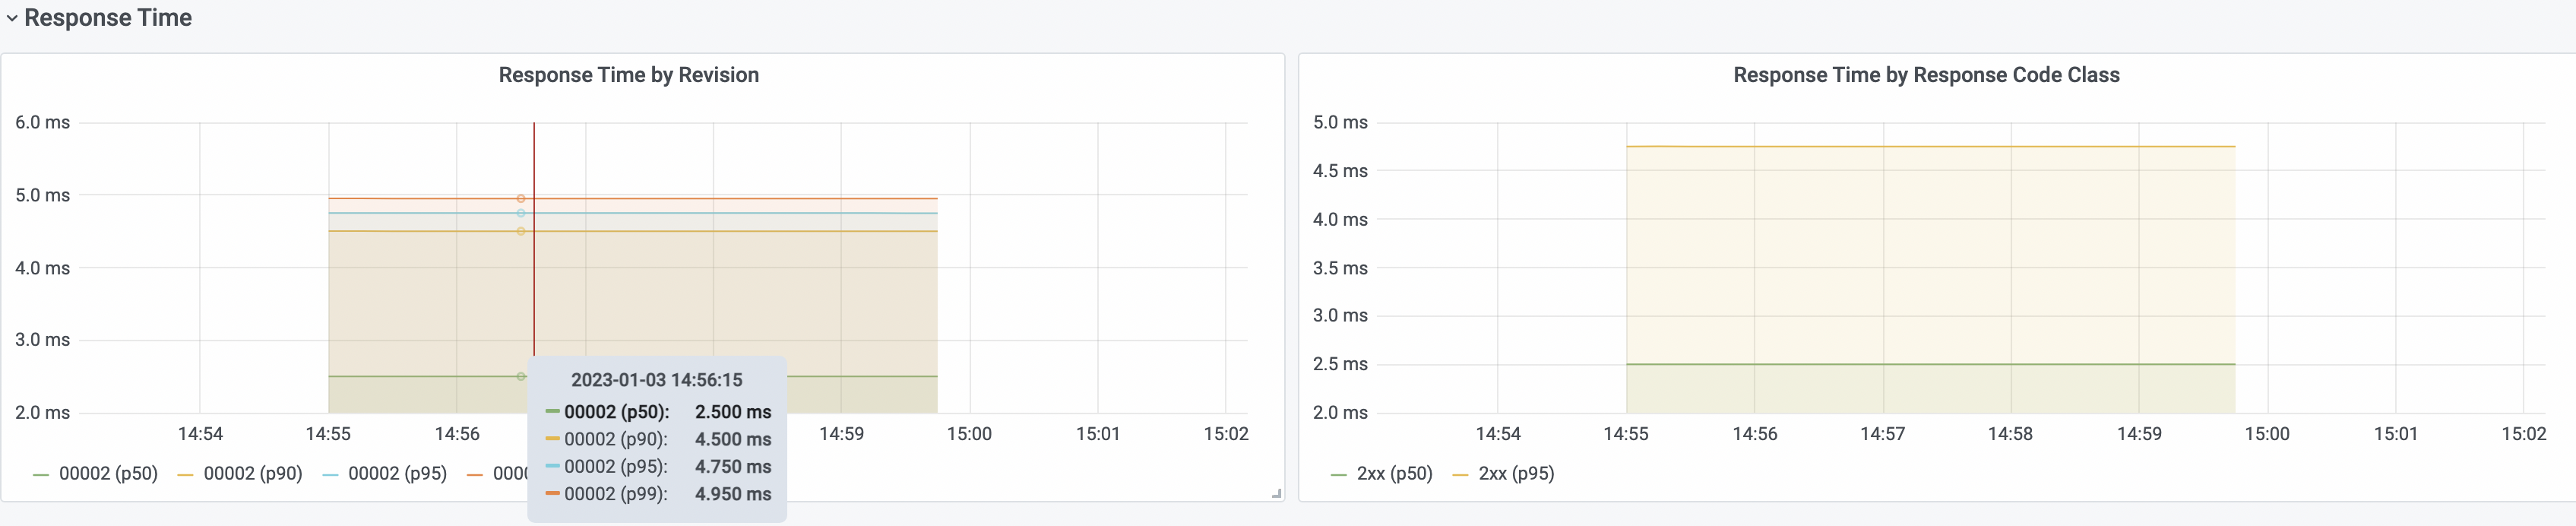
Expand the Response Time section. You can view the response latency data, including the following types: P50, P90, P95, and P99.
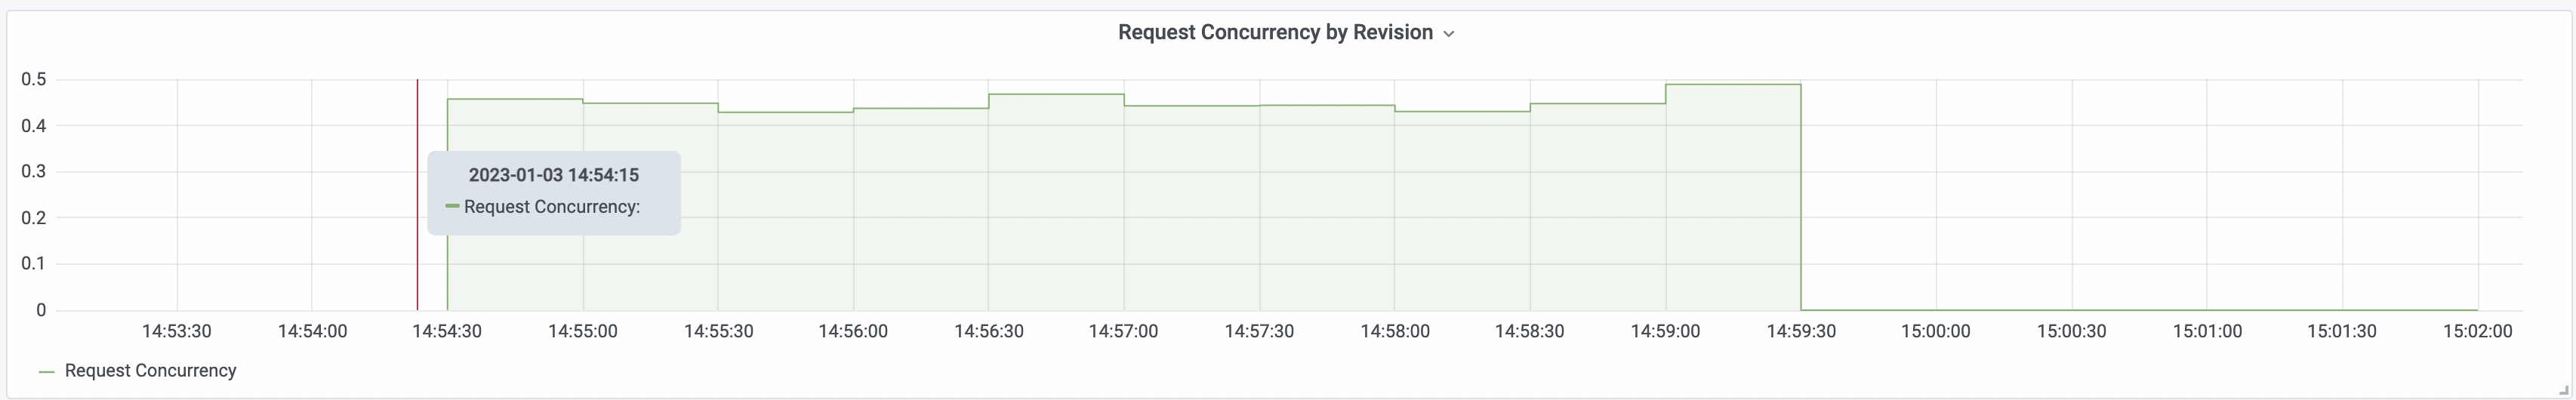
Expand the Autoscaler section. You can view the number of concurrent requests.
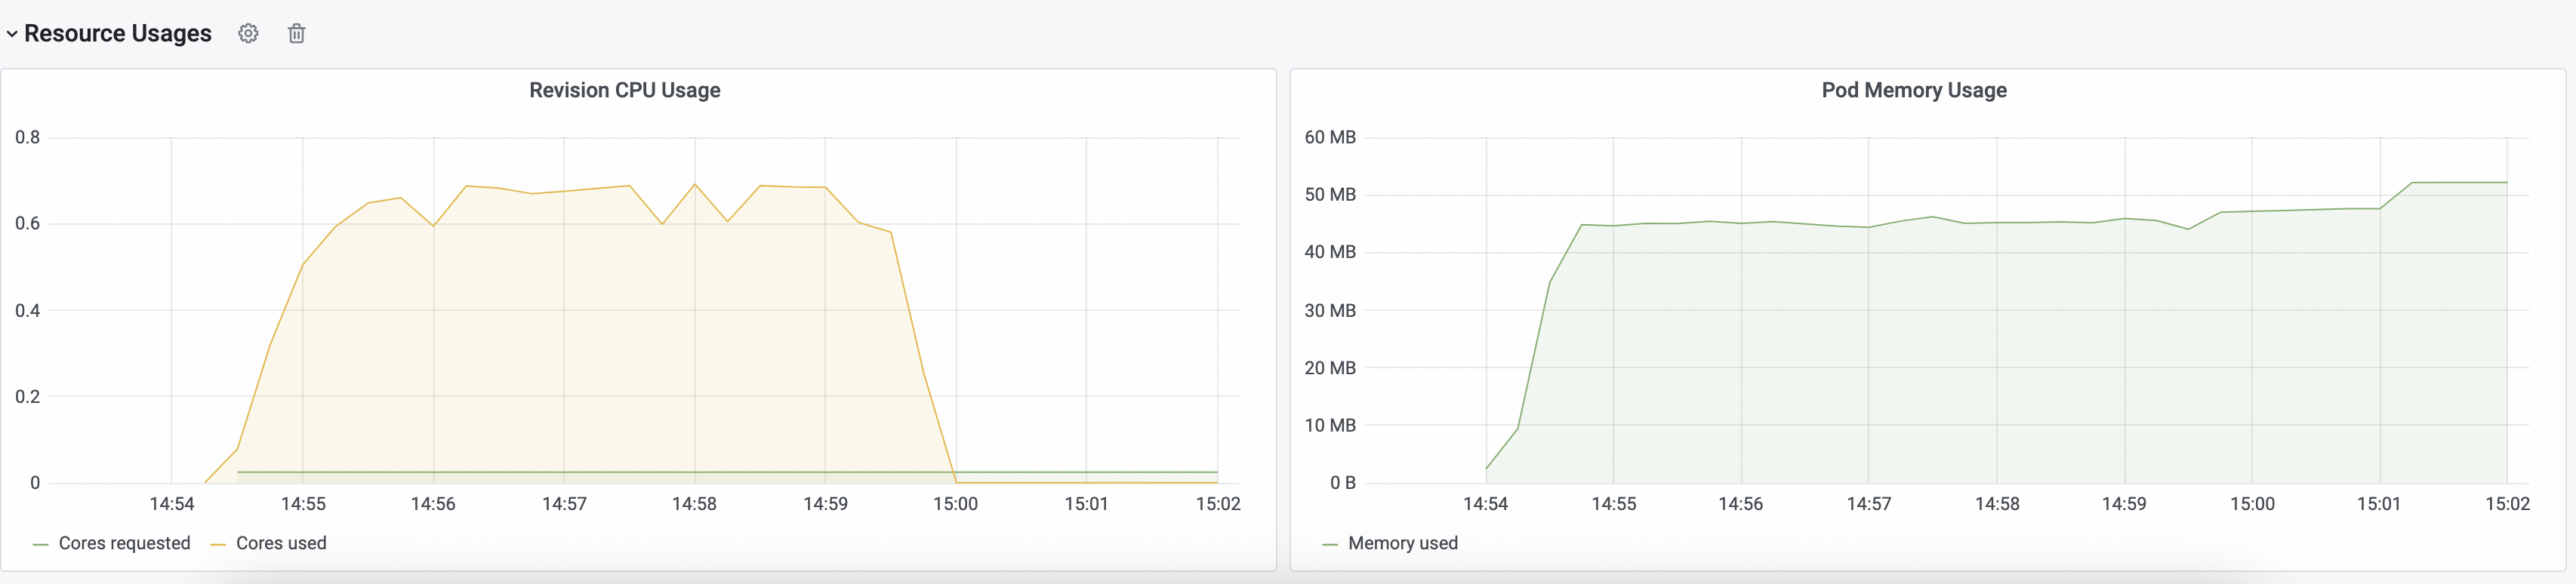
Expand the Resource Usages section. You can view the resource usage, including the CPU utilization and memory usage.
Key metrics of Knative
Metric | Description |
queue_average_concurrent_requests | The number of concurrent pod requests. |
queue_requests_per_second | The number of pod requests per second. |
revision_request_latencies | The response latency. |
revision_request_count | The number of revision requests. |