This topic describes common memory query commands and their related metrics.
Linux memory
Because the BIOS and kernel boot processes consume some memory, the MemTotal value (reported by the free command) is less than the RAM capacity.
dmesg | grep Memory
Memory: 131604168K/134217136K available (14346K kernel code, 9546K rwdata, 9084K rodata, 2660K init, 7556K bss, 2612708K reserved, 0K cma-reserved)
You can use the following commands to query Linux memory:
The Linux memory components are related by the following formula:
total = used + free + buff/cache // Total memory = Used memory + Free memory + Buffered/Cached memoryUsed memory includes the memory consumed by the kernel and all running processes.
kernel used = Slab + VmallocUsed + PageTables + KernelStack + HardwareCorrupted + Bounce + X
Process memory
The memory consumed by a process includes:
Physical memory mapped from the virtual address space.
Memory consumed by the page cache during disk I/O.
Physical memory mapped from virtual addresses
physical memory: The hardware memory modules (RAM) installed in the system.
virtual memory: The memory space provided by the operating system for a program. This space is divided into user space (user mode) and kernel space (kernel mode).

User mode: A non-privileged mode for running user programs.
Data storage in user space includes:
stack: A function stack for function calls.
memory mapping segment (MMap): An area for memory mapping.
heap: A region for dynamically allocated memory.
BSS segment: A storage area for uninitialized static variables.
Data segment: A storage area for initialized static constants.
Text segment: A storage area for executable binary code.
Programs that run in user mode map virtual addresses to physical memory using MMap.
Kernel mode: A mode for running programs that need to access operating system kernel data.
Data storage in kernel space includes:
Direct mapping area: Maps virtual addresses to physical memory using a simple offset.
VMALLOC area: A dynamic mapping space in the kernel used to map contiguous virtual addresses to non-contiguous physical memory.
Persistent kernel mapping area: Maps virtual addresses to high-end physical memory.
Fixed mapping area: A space used to meet special mapping requirements.
Physical memory that is mapped from virtual addresses can be divided into shared memory and exclusive memory. As shown in the following figure, physical memory regions 1 and 3 are exclusive to Process A, region 2 is exclusive to Process B, and region 4 is shared by Process A and Process B.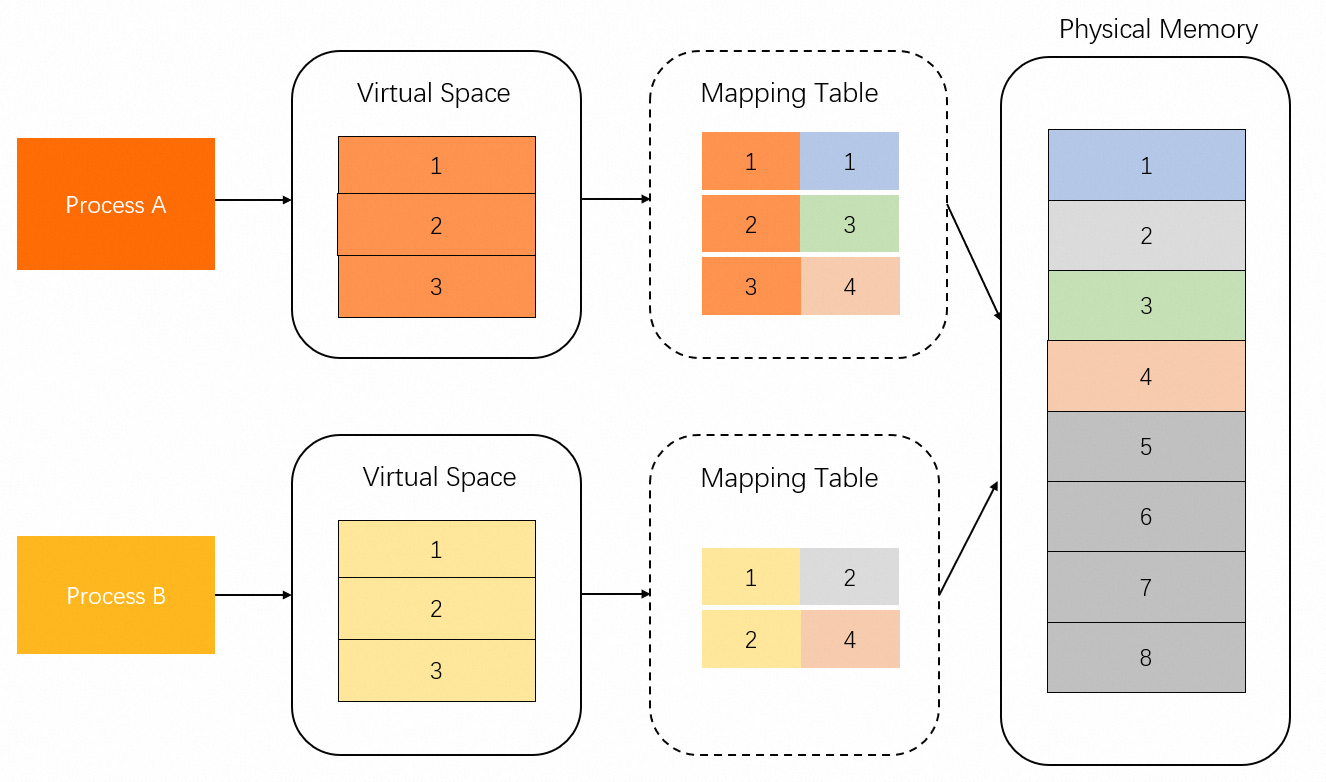
Page cache
In addition to direct mapping through MMap, a process can also write data to the page cache using buffered I/O system calls. Therefore, the page cache also consumes a portion of memory.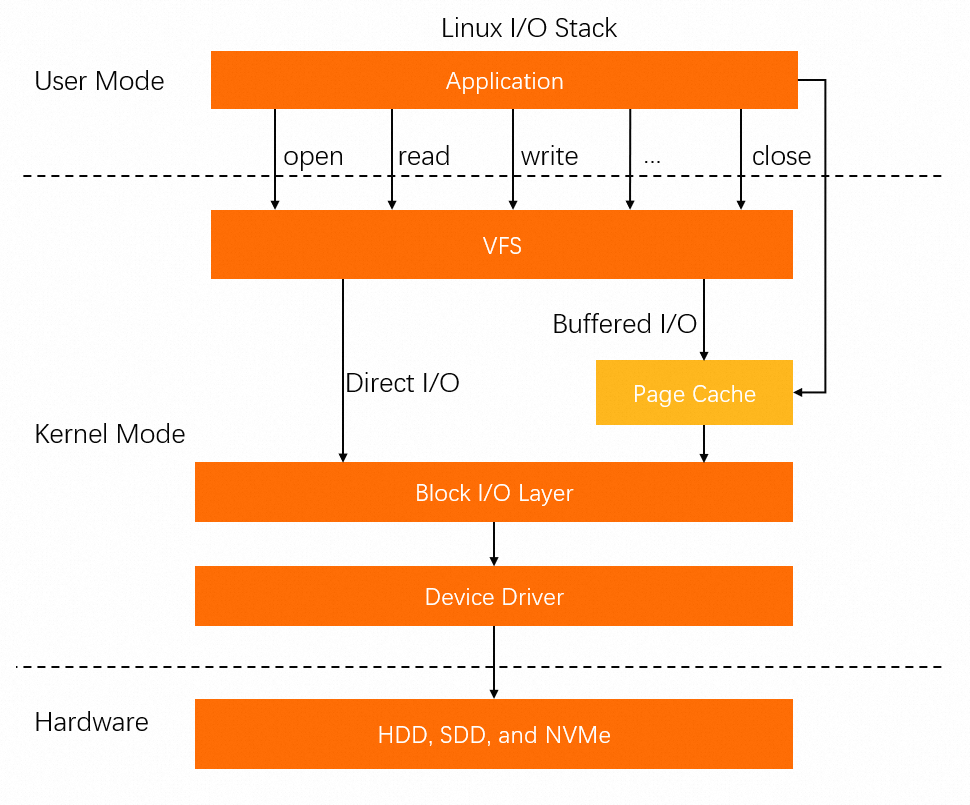
Process memory metrics
Metrics for a single process
Process resources are stored in two main types of pages:
anonymous page: Memory used by a program, such as the stack and heap, that does not correspond to a file on disk.
file-backed page: Memory backed by a file on disk, containing resources such as code segments or font data.
Related metrics:
anno_rss (RSan): The exclusive memory of the process.
file_rss (RSfd): The memory used for file-backed pages.
shmem_rss (RSsh): The shared memory used for anonymous pages.
The following table describes the commands used to query these metrics.
Command | Metric | Description | Formula |
| VIRT | The virtual address space of the process. | N/A |
RES | The Resident Set Size (RSS), which is the physical memory mapped to the process. | anno_rss + file_rss + shmem_rss | |
SHR | The shared memory size. | file_rss + shmem_rss | |
MEM% | The percentage of physical memory used. | RES / MemTotal | |
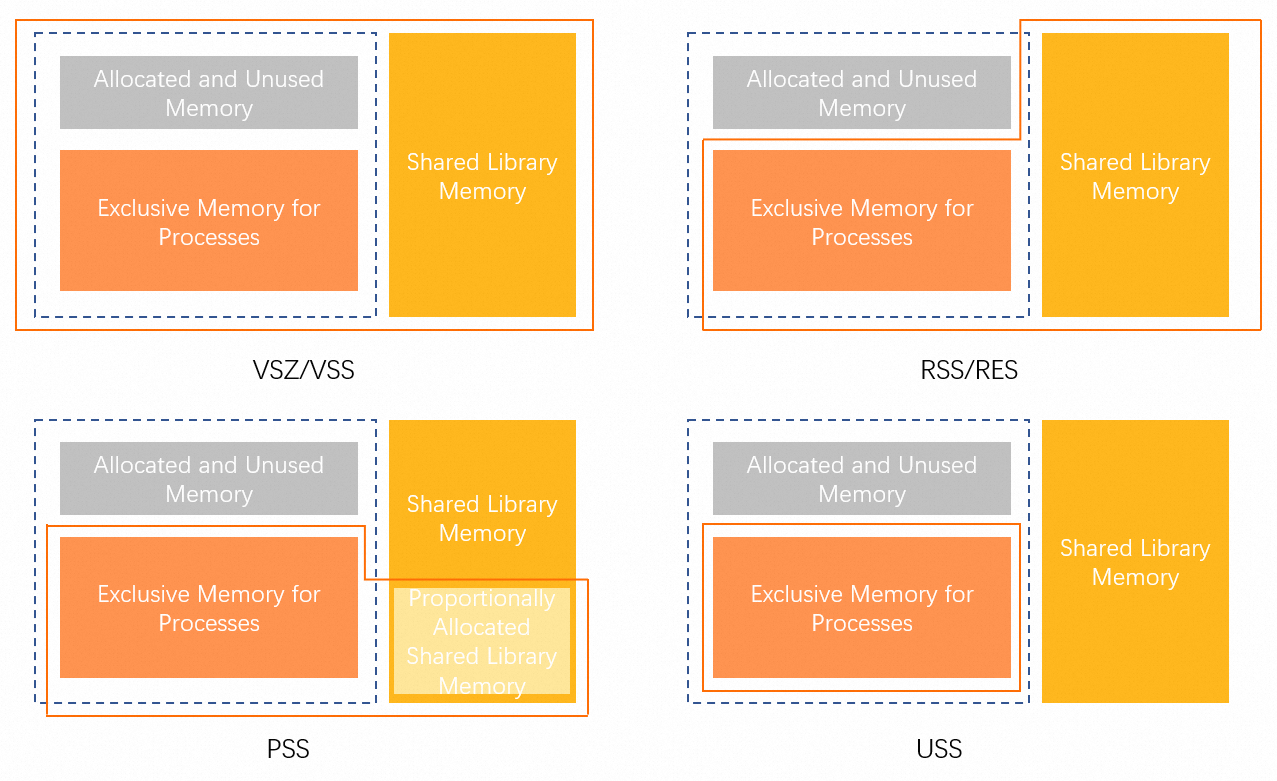
| VSZ | The virtual address space of the process. | N/A |
RSS | The Resident Set Size (RSS), which is the physical memory mapped to the process. | anno_rss + file_rss + shmem_rss | |
MEM% | The percentage of physical memory used. | RSS / MemTotal | |
| USS | The Unique Set Size (USS), which is the exclusive memory of the process. | anno_rss |
PSS | The Proportional Set Size (PSS), which is the USS plus a proportion of shared memory. | anno_rss + file_rss/m + shmem_rss/n | |
RSS | The Resident Set Size (RSS), which is the physical memory mapped to the process. | anno_rss + file_rss + shmem_rss |
The Memory Working Set Size (WSS) aims to accurately assess a process's actual memory usage. However, it remains a theoretical concept because the Linux page reclaim mechanism makes it impossible to measure precisely. Tools can only provide approximations of WSS.
Metrics for a control group (cgroup)
A control group (cgroup) is a Linux kernel feature used to limit, account for, and isolate the resource usage of processes. For more information, see the official documentation.
cgroups are organized hierarchically. Each node in the hierarchy contains a set of files that report metrics for that group. For example, the memory control group (memcg) provides statistics on memory usage.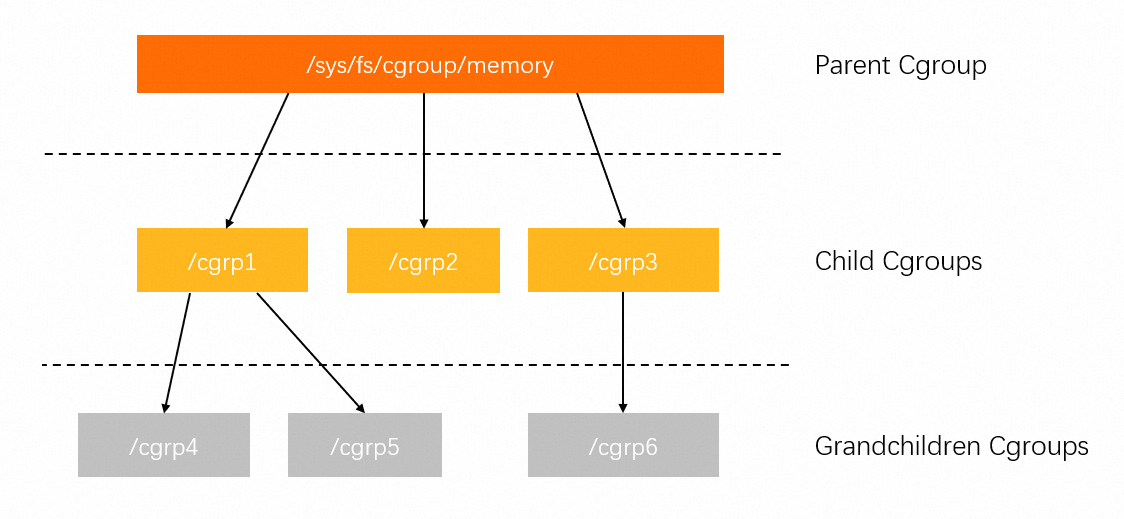
The memory cgroup directory contains files for the following metrics:
cgroup.event_control       # Interface for eventfd
memory.usage_in_bytes      # Current memory usage
memory.limit_in_bytes      # Set or show the current memory limit
memory.failcnt             # Number of times the memory limit has been reached
memory.max_usage_in_bytes  # Maximum memory usage recorded
memory.soft_limit_in_bytes # Set or show the soft memory limit
memory.stat                # Show memory statistics for the cgroup
memory.use_hierarchy       # Set or show whether to include memory usage of child cgroups
memory.force_empty         # Trigger immediate memory reclamation in the cgroup
memory.pressure_level      # Set memory pressure notifications, used with cgroup.event_control
memory.swappiness          # Set or show the current swappiness value
memory.move_charge_at_immigrate # Set whether memory charges are moved when a process migrates to another cgroup
memory.oom_control         # Set or show OOM control configurations
memory.numa_stat           # Show NUMA-related memory statistics
The three most important metrics are:
memory.limit_in_bytes: The memory limit for the cgroup. This corresponds to the memory limit in Kubernetes and Docker.
memory.usage_in_bytes: The total memory currently used by all processes in the cgroup. This value is approximately equal to the sum of the RSS and Cache values in the memory.stat file.
memory.stat: A file that contains detailed memory statistics for the cgroup.
Field
Description
cache
The size of the page cache.
rss
The total size of anonymous pages (anno_rss) used by all processes in the cgroup.
mapped_file
The total size of memory for mapped files (file_rss) and shared memory (shmem_rss) across all processes in the cgroup.
active_anon
The memory and Swap cache used by all Anonymous processes in the active LRU (least-recently-used) list, including
tmpfs(shmem), in bytes.inactive_anon
The amount of memory and Swap cache used by all anonymous processes on the inactive LRU list, including
tmpfs(shmem), is measured in bytes.active_file
The amount of memory on the active LRU list that is backed by files, in bytes.
inactive_file
The amount of memory on the inactive LRU list that is backed by files, in bytes.
unevictable
The amount of memory that cannot be reclaimed, in bytes.
If a metric is prefixed with
total_, it represents the sum of the corresponding metric for the current control group and all its descendant control groups. For example, the total_rss metric represents the sum of the RSS metric for the current control group and all its descendant control groups.
Summary
The following table compares the memory metrics for a single process and a cgroup.
Metric | Single process | Control group (memcg) |
RSS | anon_rss + file_rss + shmem_rss | anon_rss |
mapped_file | N/A | file_rss + shmem_rss |
cache | N/A | page cache |
The RSS metric for a cgroup includes only anonymous pages (anno_rss), which corresponds to the USS metric for a single process. Therefore, for a cgroup, the sum of
mapped_fileandrssis equivalent to the RSS metric of a single process.For a single process, the page cache must be measured separately. In a cgroup, the memory reported in the memcg files already includes the page cache.
Memory statistics in Docker and Kubernetes
Memory statistics in Docker and Kubernetes are based on Linux cgroups, but they define memory usage differently.
The docker stats command
The following output is an example:
For more information about how the docker stats command works, see the official documentation.
func calculateMemUsageUnixNoCache(mem types.MemoryStats) float64 {
    // cgroup v1
    if v, ok := mem.Stats["total_inactive_file"]; ok {
        if mem.Usage < v {
            return 0
        }
        return float64(mem.Usage - v)
    }
    if v, ok := mem.Stats["inactive_file"]; ok {
        if mem.Usage < v {
            return 0
        }
        return float64(mem.Usage - v)
    }

    // cgroup v2
    if v, ok := mem.Stats["inactive_file"]; ok {
        return float64(mem.Usage - v)
    }

    return float64(mem.Usage)
}
LIMIT corresponds to the
memory.limit_in_bytesof the control group.MEM USAGE corresponds to the cgroup's
memory.usage_in_bytesminus a portion of reclaimable cache, such asinactive_file.
The kubectl top pod command
The kubectl top command retrieves the working_set value from cAdvisor through Metrics Server or Heapster. This value represents the memory size used by a pod instance, excluding the pause container. The following code shows how Metrics Server retrieves pod memory. For more information, see the official documentation.
func decodeMemory(target *resource.Quantity, memStats *stats.MemoryStats) error {
    if memStats == nil || memStats.WorkingSetBytes == nil {
        return fmt.Errorf("missing memory usage metric")
    }

    *target = *uint64Quantity(*memStats.WorkingSetBytes, 0)
    target.Format = resource.BinarySI

    return nil
}
The following code shows the cAdvisor algorithm for calculating the memory working set. For more information, see the official documentation.
func setMemoryStats(s *cgroups.Stats, ret *info.ContainerStats) {
    ret.Memory.Usage = s.MemoryStats.Usage.Usage
    ret.Memory.MaxUsage = s.MemoryStats.Usage.MaxUsage
    ret.Memory.Failcnt = s.MemoryStats.Usage.Failcnt

    if s.MemoryStats.UseHierarchy {
        ret.Memory.Cache = s.MemoryStats.Stats["total_cache"]
        ret.Memory.RSS = s.MemoryStats.Stats["total_rss"]
        ret.Memory.Swap = s.MemoryStats.Stats["total_swap"]
        ret.Memory.MappedFile = s.MemoryStats.Stats["total_mapped_file"]
    } else {
        ret.Memory.Cache = s.MemoryStats.Stats["cache"]
        ret.Memory.RSS = s.MemoryStats.Stats["rss"]
        ret.Memory.Swap = s.MemoryStats.Stats["swap"]
        ret.Memory.MappedFile = s.MemoryStats.Stats["mapped_file"]
    }
    if v, ok := s.MemoryStats.Stats["pgfault"]; ok {
        ret.Memory.ContainerData.Pgfault = v
        ret.Memory.HierarchicalData.Pgfault = v
    }
    if v, ok := s.MemoryStats.Stats["pgmajfault"]; ok {
        ret.Memory.ContainerData.Pgmajfault = v
        ret.Memory.HierarchicalData.Pgmajfault = v
    }

    workingSet := ret.Memory.Usage
    if v, ok := s.MemoryStats.Stats["total_inactive_file"]; ok {
        if workingSet < v {
            workingSet = 0
        } else {
            workingSet -= v
        }
    }
    ret.Memory.WorkingSet = workingSet
}
Based on this algorithm, the Memory Usage reported by the kubectl top pod command is calculated as follows: Memory Usage = Memory WorkingSet = memory.usage_in_bytes - memory.stat[total_inactive_file].
Summary
Command | Ecosystem | Memory usage calculation |
| Docker | memory.usage_in_bytes - memory.stat[inactive_file] |
| Kubernetes | memory.usage_in_bytes - memory.stat[total_inactive_file] |
If you use the top or ps commands to query memory, you must use the following formulas to calculate the Memory Usage metric for the cgroup based on the retrieved metrics:
Cgroup ecosystem | Formula |
Memcg | rss + cache (active cache + inactive cache) |
Docker | rss + active cache |
Kubernetes | rss + active cache |
Java memory statistics
Virtual address space of a Java process
The following figure shows the distribution of data storage areas within the virtual address space of a Java process: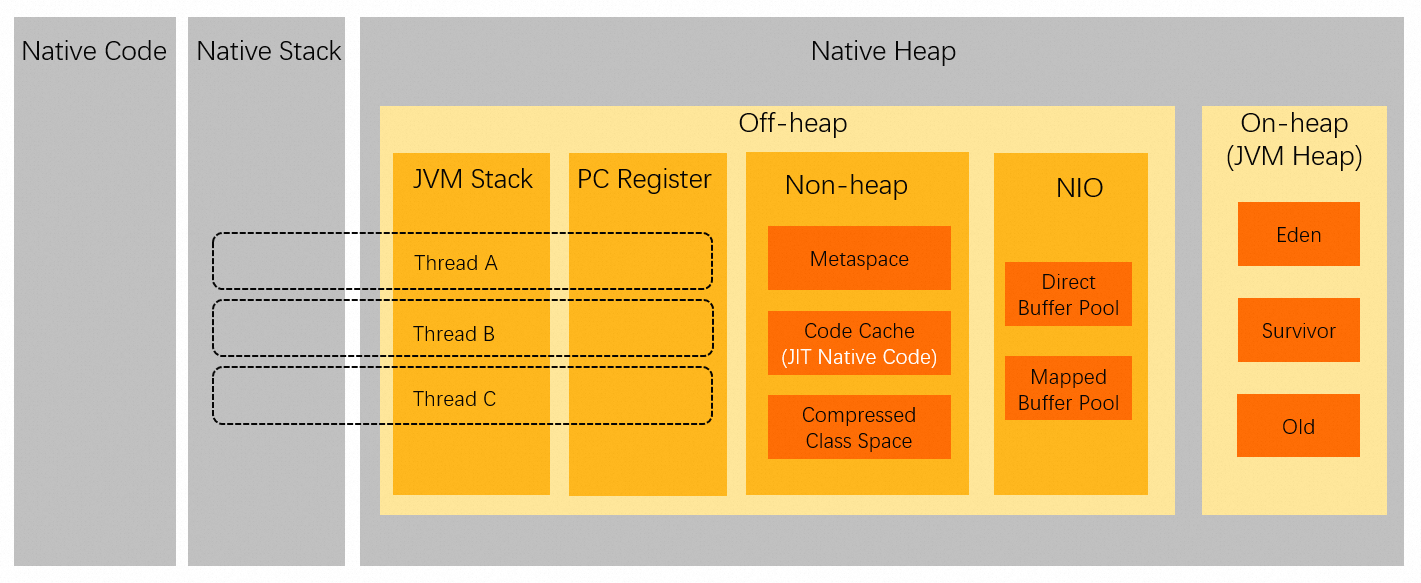
Obtain memory metrics using JMX
You can obtain Java process memory metrics from data exposed by JMX, for example, using JConsole.
Memory-related data is exposed through MBeans.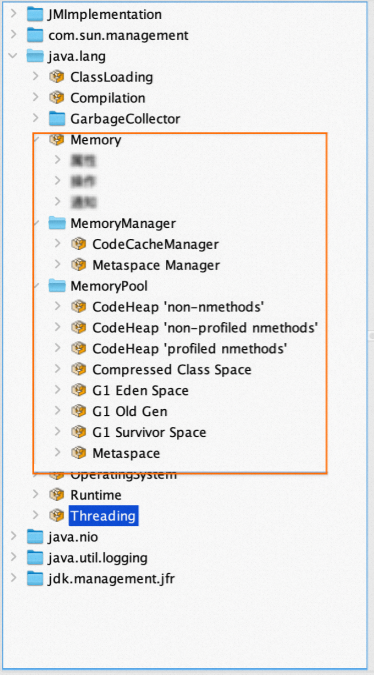
The metrics exposed by JMX do not represent the total memory usage of a JVM process. For example, the memory consumed by Java threads is not included. Therefore, the sum of memory usage values from JMX does not equal the RSS value of the JVM process.
The JMX MemoryUsage tool
JMX exposes the concept of MemoryUsage through MemoryPool MBeans. For more information, see the official documentation.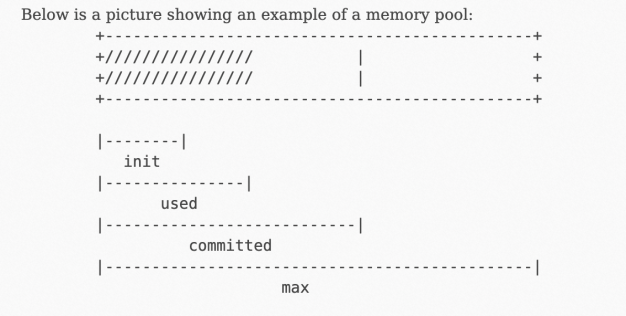
The used parameter represents the physical memory consumption.
The NMT tool
The Java Hotspot VM provides a tool called Native Memory Tracking (NMT) for tracking memory usage. For more information about how to use it, see the official documentation.
NMT introduces additional overhead and is not recommended for use in production environments.
The following is an example of the memory metrics obtained from NMT:
jcmd 7 VM.native_memory

Native Memory Tracking:

Total: reserved=5948141KB, committed=4674781KB
-                 Java Heap (reserved=4194304KB, committed=4194304KB)
                            (mmap: reserved=4194304KB, committed=4194304KB)

-                     Class (reserved=1139893KB, committed=104885KB)
                            (classes #21183)
                            (  instance classes #20113, array classes #1070)
                            (malloc=5301KB #81169)
                            (mmap: reserved=1134592KB, committed=99584KB)
                            (  Metadata:   )
                            (    reserved=86016KB, committed=84992KB)
                            (    used=80663KB)
                            (    free=4329KB)
                            (    waste=0KB =0.00%)
                            (  Class space:)
                            (    reserved=1048576KB, committed=14592KB)
                            (    used=12806KB)
                            (    free=1786KB)
                            (    waste=0KB =0.00%)

-                    Thread (reserved=228211KB, committed=36879KB)
                            (thread #221)
                            (stack: reserved=227148KB, committed=35816KB)
                            (malloc=803KB #1327)
                            (arena=260KB #443)

-                      Code (reserved=49597KB, committed=2577KB)
                            (malloc=61KB #800)
                            (mmap: reserved=49536KB, committed=2516KB)

-                        GC (reserved=206786KB, committed=206786KB)
                            (malloc=18094KB #16888)
                            (mmap: reserved=188692KB, committed=188692KB)

-                  Compiler (reserved=1KB, committed=1KB)
                            (malloc=1KB #20)

-                  Internal (reserved=45418KB, committed=45418KB)
                            (malloc=45386KB #30497)
                            (mmap: reserved=32KB, committed=32KB)

-                     Other (reserved=30498KB, committed=30498KB)
                            (malloc=30498KB #234)

-                    Symbol (reserved=19265KB, committed=19265KB)
                            (malloc=16796KB #212667)
                            (arena=2469KB #1)

-    Native Memory Tracking (reserved=5602KB, committed=5602KB)
                            (malloc=55KB #747)
                            (tracking overhead=5546KB)

-        Shared class space (reserved=10836KB, committed=10836KB)
                            (mmap: reserved=10836KB, committed=10836KB)

-               Arena Chunk (reserved=169KB, committed=169KB)
                            (malloc=169KB)

-                   Tracing (reserved=16642KB, committed=16642KB)
                            (malloc=16642KB #2270)

-                   Logging (reserved=7KB, committed=7KB)
                            (malloc=7KB #267)

-                 Arguments (reserved=19KB, committed=19KB)
                            (malloc=19KB #514)

-                    Module (reserved=463KB, committed=463KB)
                            (malloc=463KB #3527)

-              Synchronizer (reserved=423KB, committed=423KB)
                            (malloc=423KB #3525)

-                 Safepoint (reserved=8KB, committed=8KB)
                            (mmap: reserved=8KB, committed=8KB)
The output shows that the JVM internally allocates memory for various specific purposes, such as the Java Heap and Class areas, but also for many other internal uses. Furthermore, JMX does not report memory used by threads. Because a Java application can have tens of thousands of threads, this untracked memory can be significant.
For details on how memory types are defined within HotSpot, see the official documentation.
Reserved and Committed metrics
The NMT output introduces two concepts: Reserved and Committed. However, neither Reserved nor Committed can be directly mapped to the used physical memory (Used).
The following figure shows the mapping relationship between virtual addresses (Reserved and Committed) and physical memory. The Committed value is typically greater than the Used value (physical memory in use), which is roughly equivalent to the JVM process's RSS.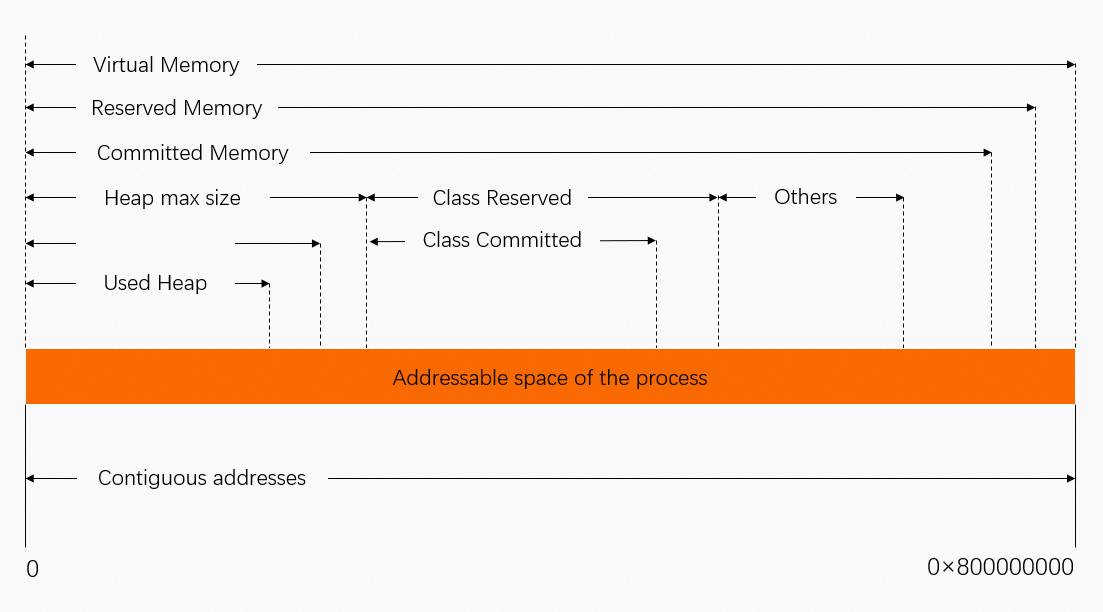
Summary
Metrics collected by common Java application monitoring tools are primarily exposed through JMX. For memory statistics, JMX exposes several trackable memory pools within the JVM. The sum of these pools does not map directly to the RSS of the JVM process.
NMT exposes details about the internal memory usage of the JVM. However, its primary metrics are Reserved and Committed, not the actual physical memory used (RSS). As a result, the total Committed memory reported by NMT is typically slightly larger than the process's RSS.
NMT cannot track memory allocated outside of the JVM. If a Java program makes native allocations, for example, through malloc, NMT does not report this usage. Therefore, it is normal to see an RSS value larger than the total memory reported by NMT.
If there is a large discrepancy between the Committed memory reported by NMT and the process RSS, it may indicate a memory leak.
You can use other NMT features to investigate further:
Use NMT's baseline and diff features to identify which internal JVM area is causing the issue.
Use NMT in combination with
pmapto investigate memory issues outside the JVM.