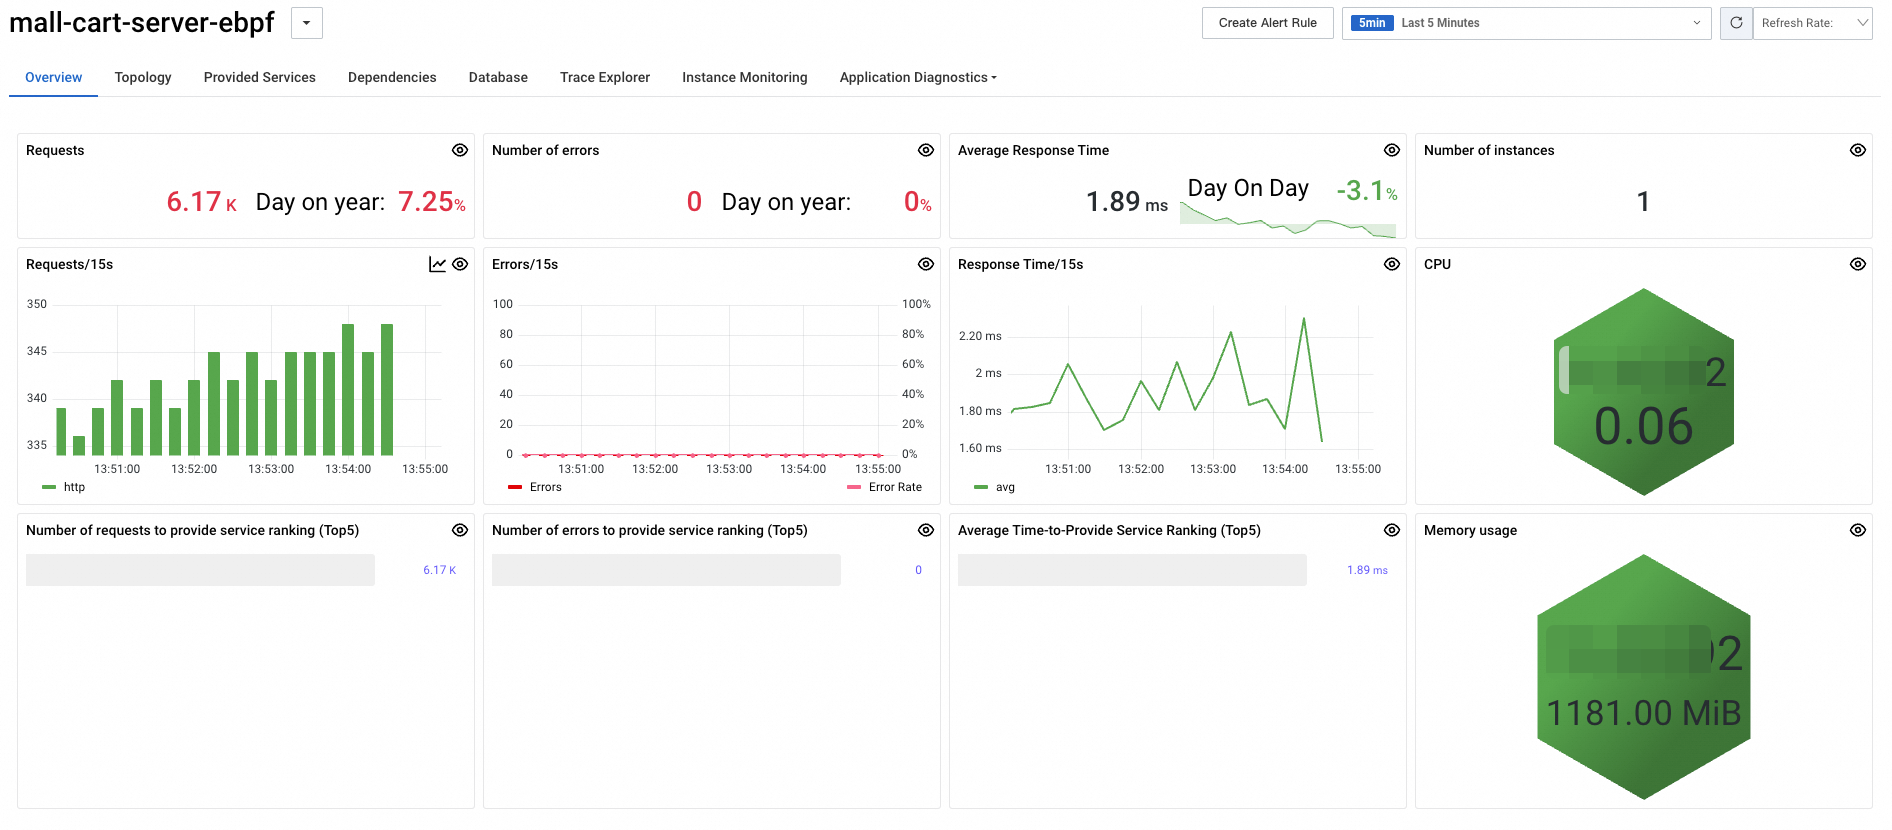
The Overview page of Application Real-Time Monitoring Service (ARMS) displays the metrics of the application, such as the number of requests, number of errors, average duration, and number of instances.
Procedure
Log on to the ARMS console. In the left-side navigation pane, choose .
In the top navigation bar, select a region.
On the Application List page, click the name of the application.
Feature description
The Overview dashboard displays the service rankings of the number of requests, number of errors, average duration, number of instances, CPU utilization, memory usage, number of requests, number of errors, and average duration of services.
Contact us
If you have any questions about using Application Monitoring eBPF Edition, join the DingTalk group (ID: 35568145) to obtain technical support.