Message accumulation occurs when messages build up in an ApsaraMQ for RabbitMQ queue faster than consumers process them. Left unresolved, accumulation increases RAM pressure, triggers disk paging, and further degrades queue throughput -- creating a feedback loop that requires immediate action.
Possible causes
Insufficient consumer capacity
When the message sending rate exceeds the consumption rate, messages accumulate in the queue. This typically happens when:
Consumer-side processing is slow due to blocking I/O, database queries, or external API calls.
Too few consumer instances are running relative to the message volume.
Bursty traffic
A sudden spike in message volume can temporarily overwhelm consumers. If consumer capacity is sufficient under normal load, the backlog clears after the spike subsides.
Misconfigured QoS prefetch count
An incorrect prefetch count causes accumulation even when overall consumer capacity is sufficient. Scaling out consumers does not fix this problem.
Prefetch too high: A single consumer pulls too many messages from the queue, starving other consumers. For example, if the prefetch count is 100 and each message takes 30 seconds to process with a longest consumption duration of 300 seconds, only the first 10 messages are processed on schedule. The remaining 90 messages block until earlier ones finish, causing accumulation.
Prefetch too low: The broker idles between deliveries because it waits for an acknowledgment before sending the next message. This leaves consumer capacity underutilized and slows overall throughput.
Diagnose the issue
Before applying a fix, verify that consumers are connected and processing messages as expected.
Step 1: Check message delivery logs
Enable the message log management feature, then check whether the number of pushed messages in the affected queue matches expectations. For more information, see Configure message logs.
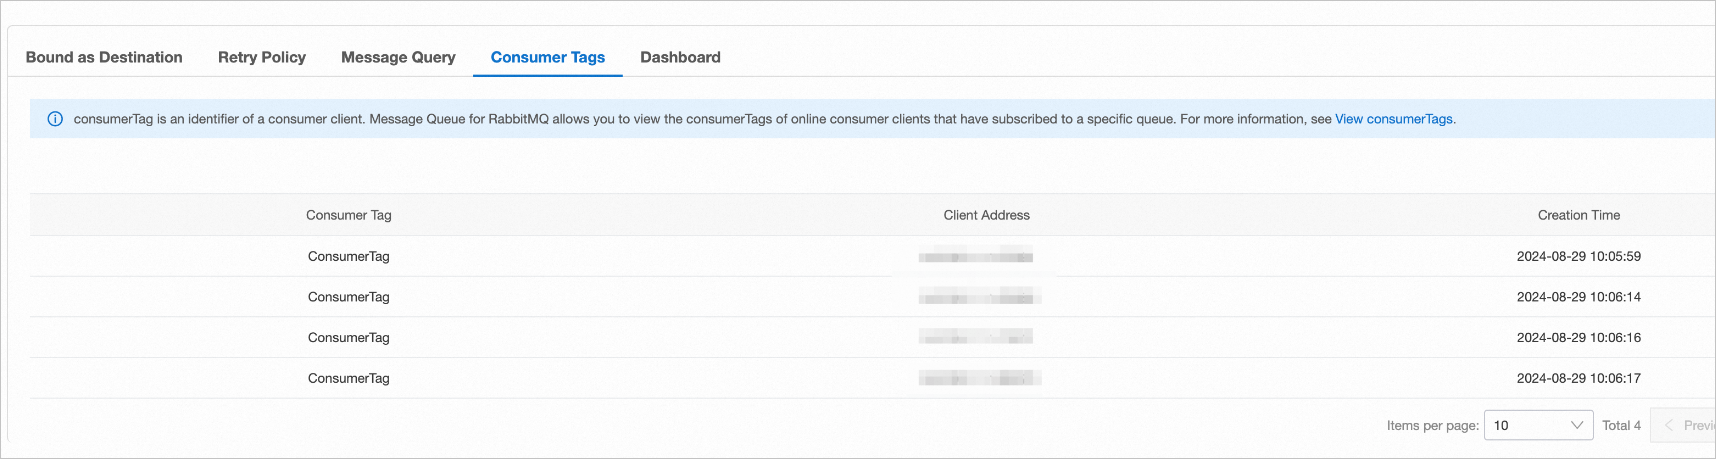
Step 2: Verify consumer connections
Open the queue details page in the ApsaraMQ for RabbitMQ console and check the number of consumer IP addresses. Make sure all expected consumer instances are connected.
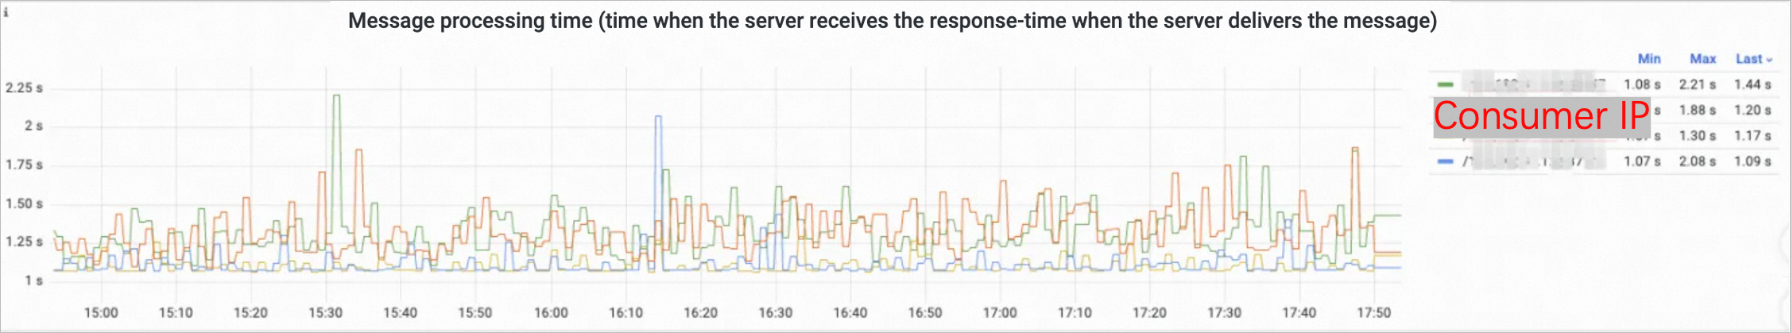
Step 3: Review consumption duration
Open the dashboard of the affected queue and check the consumption duration of each consumer.
In a healthy queue, each consumer processes messages within the expected time range:
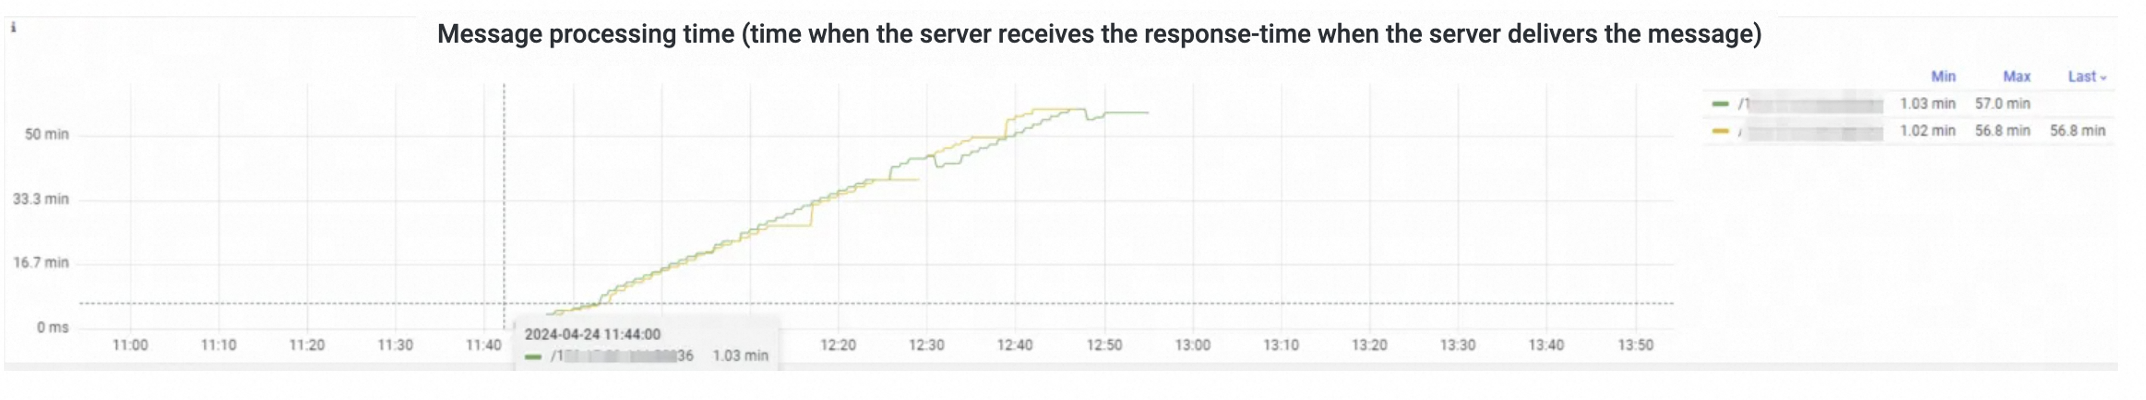
If all messages time out, the chart shows a flat timeout pattern:
Solutions
Configure the prefetch count correctly
Calculate the optimal prefetch count:
Prefetch count = Longest consumption duration / Longest processing duration per messageFor example, if the longest consumption duration is 300 seconds and each message takes at most 30 seconds to process, set the prefetch count to 10.
For more information, see What precautions do I need to take during message consumption?
Scale out consumers
Monitor consumer process load. If CPU or memory utilization is high, add more consumer instances to distribute the workload. Scaling out consumers resolves most accumulation issues caused by insufficient capacity.