Create a sink connector to continuously export messages from an ApsaraMQ for Kafka topic to an Elasticsearch index. The connector reads messages from Kafka, encodes them in the format you specify, and writes them to Elasticsearch through Function Compute.
Before you begin
Complete the general prerequisites for connectors. See Prerequisites.
Gather the following information before you start:
| Item | Where to find it |
|---|---|
| ApsaraMQ for Kafka instance ID | Overview page in the ApsaraMQ for Kafka console |
| Source topic name | Topics page in the ApsaraMQ for Kafka console |
| Consumer group ID | Groups page in the ApsaraMQ for Kafka console |
| Elasticsearch cluster ID | Instances page in the Elasticsearch console |
| Elasticsearch logon name and password | Credentials set during Elasticsearch cluster creation |
| Elasticsearch index name | Kibana console of the Elasticsearch cluster |
Step 1: Prepare Elasticsearch resources
Create an Elasticsearch instance and an index in the Elasticsearch console. See Getting started.
If the connector accesses Elasticsearch through a Virtual Private Cloud (VPC), add the CIDR block of the Function Compute endpoint to the IP address whitelist of the Elasticsearch cluster. See Configure a public or private IP address whitelist for an Elasticsearch cluster.
Step 2: Create the connector
Log on to the ApsaraMQ for Kafka console. In the Resource Distribution section of the Overview page, select the region where your instance resides.
In the left-side navigation pane, choose Connector Ecosystem Integration > Tasks.
On the Tasks page, click Create Task.
On the Create Task page, set Task Name and Description, then configure the source, filtering, transformation, and sink settings described in the following sections.
Configure the source
In the Source step, set Data Provider to Message Queue for Apache Kafka and configure the following parameters. Click Next Step when finished.
| Parameter | Description | Example |
|---|---|---|
| Region | Region where the ApsaraMQ for Kafka instance resides. | China (Hangzhou) |
| Message Queue for Apache Kafka Instance | ID of the instance that produces the messages to export. | alikafka_post-cn-9hdsbdhd\*\*\*\* |
| Topic | Topic that contains the messages to export. | guide-sink-topic |
| Group ID | Consumer group used by the connector. Quickly Create -- the system creates a group with the ID format GID_EVENTBRIDGE_xxx. Use Existing Group -- select an existing group that is not in use. Selecting a group already in use affects existing message subscriptions. | Use Existing Group |
| Consumer Offset | Starting position for message consumption. Latest Offset -- start from the most recent message. Earliest Offset -- start from the oldest available message. | Latest Offset |
| Network Configuration | Select Internet for cross-border data transmission. Select Basic Network in other cases. | Basic Network |
| Data Format | Encoding applied to binary message data before delivery. Json (default) -- encodes binary data as JSON using UTF-8 and places it in the payload. Text -- encodes binary data as strings using UTF-8 and places it in the payload. Binary -- encodes binary data as strings using Base64 and places it in the payload. | Json |
| Messages | Maximum number of messages sent per function invocation. Messages are sent only when the backlog reaches this value. Valid values: 1 to 10,000. | 2000 |
| Interval (Unit: Seconds) | Interval at which aggregated messages are sent to Function Compute. Valid values: 0 to 15 seconds. A value of 0 sends messages immediately after aggregation. | 3 |
Configure filtering and transformation
In the Filtering step, define a data pattern to filter messages. See Message filtering.
In the Transformation step, specify a data cleansing method to process messages through splitting, mapping, enrichment, or dynamic routing. See Use Function Compute to perform message cleansing.
Configure the sink
In the Sink step, set Service Type to Elasticsearch acs.elasticSearch and configure the following parameters.
| Parameter | Description | Example |
|---|---|---|
| Elasticsearch Cluster | ID of the Elasticsearch cluster to write to. | es-cn-pe336j0gj001e\*\*\*\* |
| Cluster Logon Name | Username for the Elasticsearch cluster. The default is elastic. | elastic |
| Cluster Logon Password | Password set during Elasticsearch cluster creation. | \*\*\*\*\*\* |
| Index Name | Target index in Elasticsearch. Accepts a string constant or a JSONPath expression (such as $.data.key) to extract the index name dynamically from the message. | product_info |
| Document Type | Document type for indexing. Accepts a string constant or a JSONPath expression. Available only for Elasticsearch versions earlier than 7. Default: _doc. | \_doc |
| Document | Scope of the event data to deliver. Select Complete Event to send the full message, or Partial Event to send specific fields extracted by a JSONPath rule. | Complete Event |
| Network Settings | Network path for message delivery. VPC -- deliver through a VPC. Internet -- deliver over the public internet. | Internet |
| VPC | VPC to which the Elasticsearch instance belongs. Required when Network Settings is set to VPC. | vpc-bp17fapfdj0dwzjkd\*\*\*\* |
| vSwitch | vSwitch to which the Elasticsearch instance belongs. Required when Network Settings is set to VPC. | vsw-bp1gbjhj53hdjdkg\*\*\*\* |
| Security Group | Security group of the Elasticsearch instance. Required when Network Settings is set to VPC. | test\_group |
Configure the task property
Configure the retry policy for failed event delivery and the fault handling method. See Retry policies and dead-letter queues.
Save and verify
Click Save. On the Tasks page, find the connector. When the Status column changes from Starting to Running, the connector is active and processing messages.
Step 3: Verify the data flow
After the connector starts running, send a test message through the ApsaraMQ for Kafka console and confirm it arrives in Elasticsearch.
On the Tasks page, find the connector and click the source topic name in the Event Source column.
On the Topic Details page, click Send Message.
In the Start to Send and Consume Message panel, enter a test message and click OK. For example, enter the following JSON payload:
   {
     "product_id": "12345",
     "product_name": "Example Product",
     "price": 99.99
   }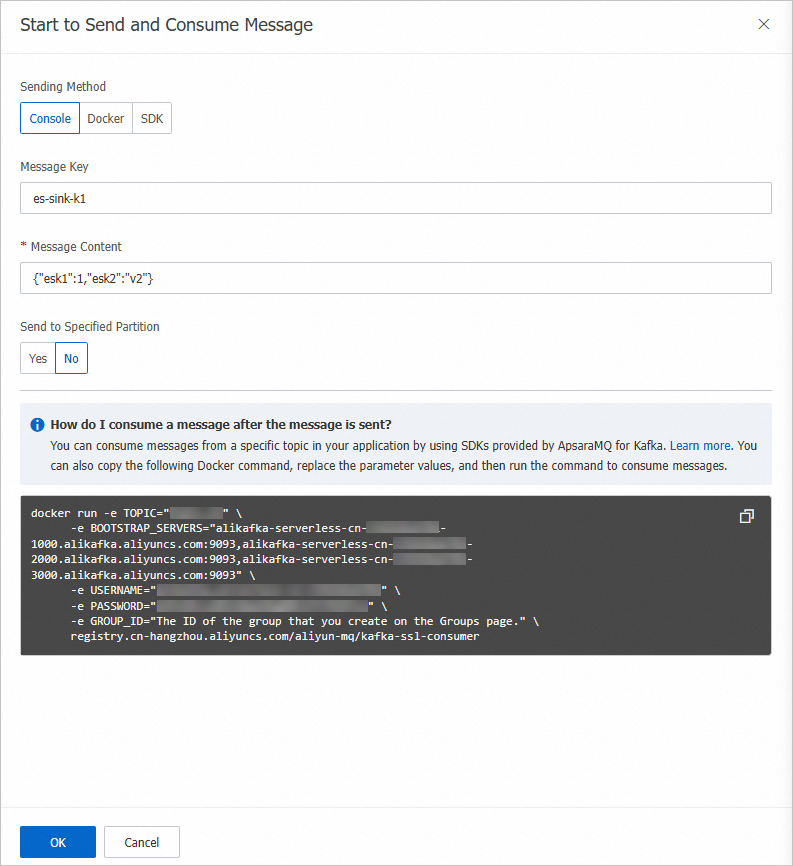
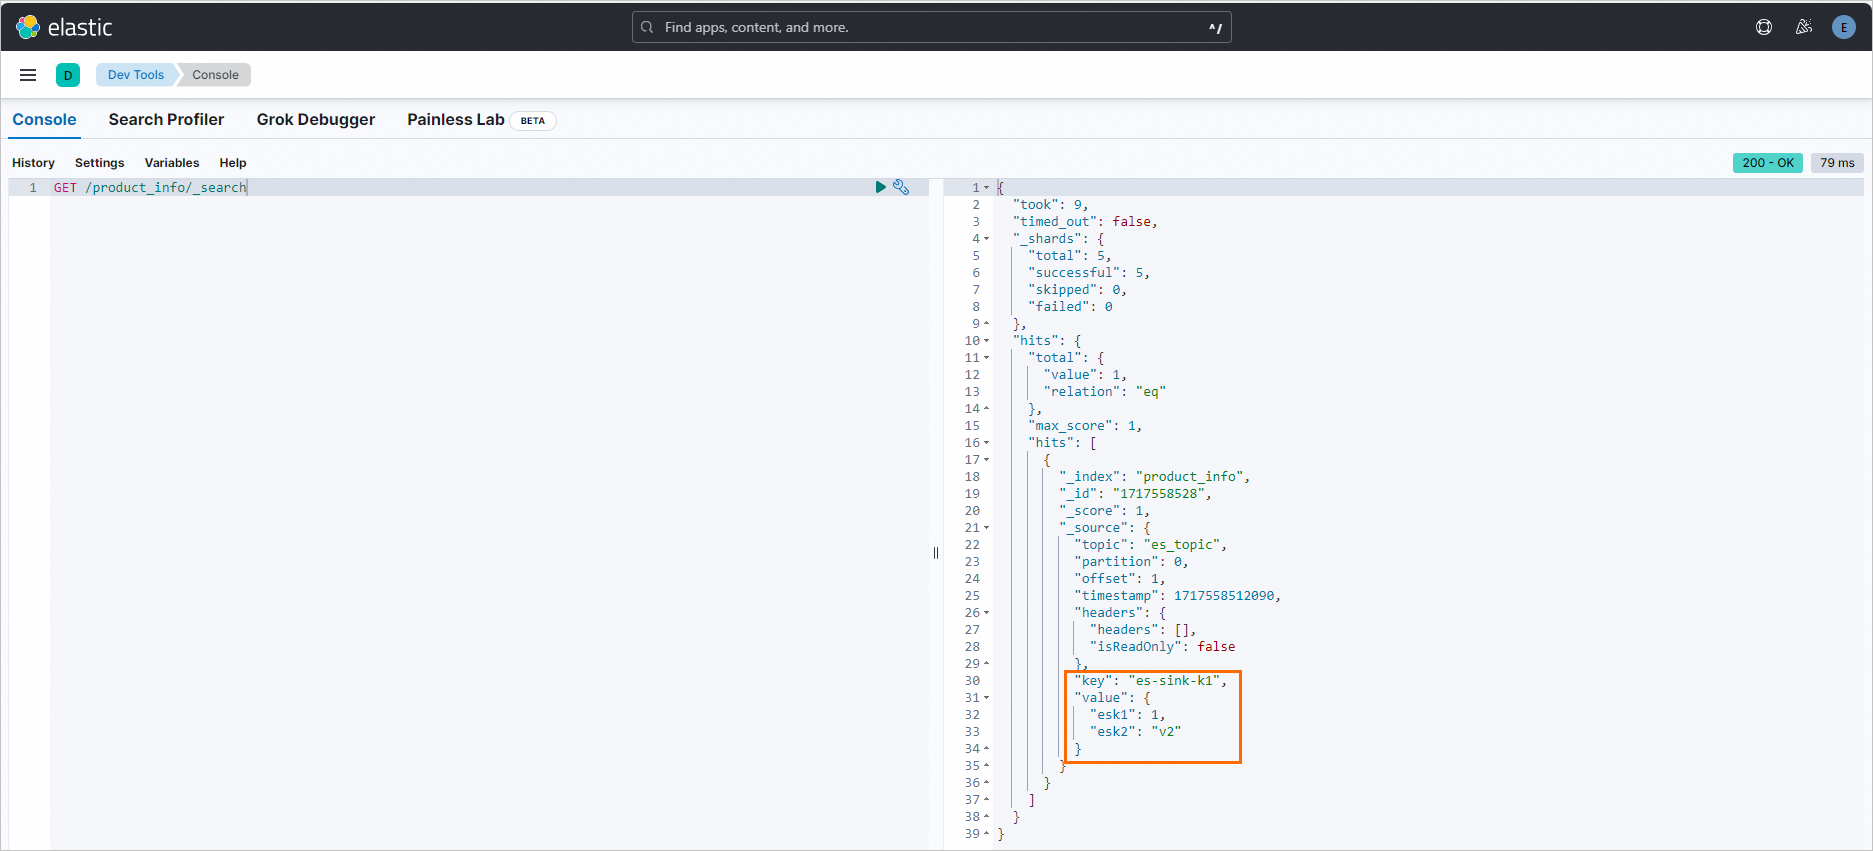
Log on to the Elasticsearch console and open Kibana for the target cluster. See Getting started.
In the Kibana console, run the following command to confirm that the test message was written to the index: Replace
<index-name>with the name of the index you created in Step 1. A successful result contains the test message in thehitsarray:GET /<index-name>/_search{ "hits": { "total": { "value": 1 }, "hits": [ { "_source": { "product_id": "12345", "product_name": "Example Product", "price": 99.99 } } ] } }