If you want to specify RDS instances and metrics to monitor and compare the metrics of RDS instances, you can use the monitoring dashboard feature. This feature allows you to configure metric linkage. This provides you with an overall understanding of the health status of ApsaraDB RDS for MySQL instances.
Prerequisites
Your RDS instance runs RDS High-availability Edition.
Database Autonomy Service (DAS) provides the monitoring dashboard feature for ApsaraDB RDS for PostgreSQL from May 20, 2022.
Create a monitoring dashboard
Log on to the ApsaraDB RDS console.
In the left-side navigation pane, choose Maintenance & Monitoring > Performance Monitoring.
On the Performance Monitoring page, click the Monitoring Dashboard tab.
On the SQL Server tab, click Add Monitoring Dashboard.
In the dialog box that appears, configure the Dashboard Name parameter and click OK.
Click Select Instances and Metrics, select the RDS instances and the metrics that are required, and then click the
 icon. Note
You can select up to 32 RDS instances at a time.
For more information about metrics, see Metrics.
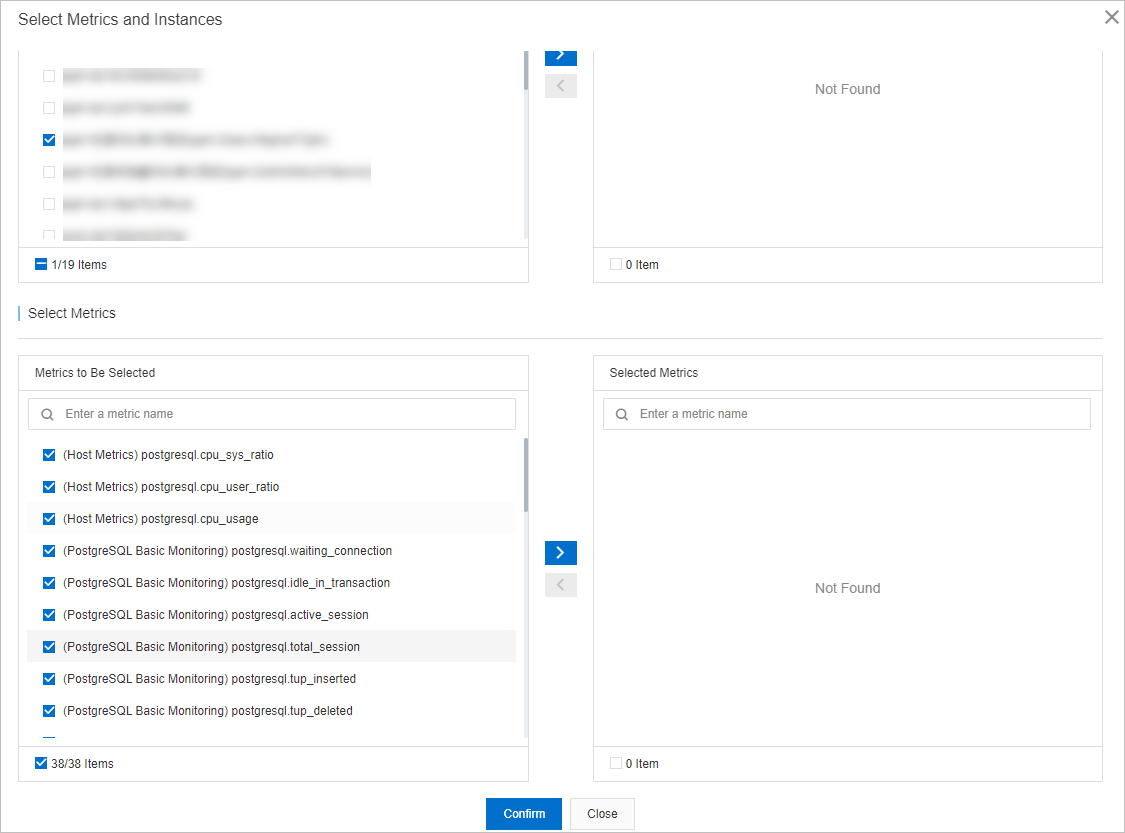
Click Confirm.
NoteTo modify the RDS instances or metrics that you select in the monitoring dashboard, click Add Instances and Metrics.
View the metric trends of an RDS instance in the monitoring dashboard
Log on to the ApsaraDB RDS console.
In the left-side navigation pane, choose Maintenance & Monitoring > Performance Monitoring.
On the Performance Monitoring page, click the Monitoring Dashboard tab.
Click the tab for the database engine, select the monitoring dashboard that you want to view, and then specify a time range to view the trend charts of the metrics during the specified time range.
NoteWhen you select a time range, the end time must be later than the start time, and the interval between the start time and the end time cannot exceed seven days.
You can configure the Instance filtering parameter to filter for multiple RDS instances and then view and compare the metrics of the RDS instances.
You can turn on Auto Refresh (Every 5 Seconds) for the system to refresh the trend charts of the metrics every 5 seconds.
You can turn on Linkage Chart to view the values of different metrics at the same point in time.
You can configure Chart Layout to specify the number of metric trend charts that can be displayed in each row.
You can click Add Instances and Metrics to modify the RDS instances or metrics in the dashboard.
You can click Details in the trend chart of a metric to expand the chart. You can also change the time range to view the changes in the trend of the metric at the specified time range.
You can click Delete in the trend chart of a metric to delete the chart from the dashboard.
Metrics
Category | Parameter | Description |
Host | cpu_sys_ratio | The CPU utilization of the PostgreSQL process in the kernel state. |
cpu_user_ratio | The CPU utilization of the PostgreSQL process in the user state. | |
cpu_usage | The CPU utilization of the PostgreSQL process. | |
mem_usage | The memory usage of the PostgreSQL process. | |
data.r_s | The read IOPS of the disk on which the data directory resides. | |
data.iops | The IOPS of the disk on which the data directory resides. | |
data.w_s | The write IOPS of the disk on which the data directory resides. | |
local_fs_size_total | The total amount of disk space of the server. | |
data.fs.used | The amount of used space of the disk on which the data directory resides. | |
data.fs.usage | The space usage of the disk on which the data directory resides. | |
network_out_io | The outbound network traffic of the PostgreSQL process. | |
network_io | The network traffic of the PostgreSQL process. | |
network_in_io | The inbound network traffic of the PostgreSQL process. | |
PostgreSQL basic monitoring | waiting_connection | The number of pending connections. |
idle_in_transaction | The number of idle sessions. | |
active_session | The number of active connections. | |
total_session | The total number of current connections. | |
tup_inserted | The number of records that are inserted per second. | |
tup_deleted | The number of records that are deleted per second. | |
tup_updated | The number of records that are updated per second. | |
tup_returned | The number of records that are returned per second for full table scans. | |
tup_fetched | The number of records that are returned per second for index scans. | |
tps | The transactions per second (TPS) in PostgreSQL. | |
xact_rollback | The number of transactions that are rolled back per second. | |
xact_commit | The number of transactions that are committed per second. | |
deadlocks | The number of deadlocks per second. | |
oldest_snapshot | The point in time before which the generated dead tuples can be recycled by the RDS instance. | |
max_sent_delay | The latency of data replication from the secondary RDS instance. | |
max_replay_delay | The latency at which the secondary RDS instance replays transaction commits. | |
long_query_5s | The number of SQL statements whose execution duration is greater than or equal to five seconds. | |
long_query_1s | The number of SQL statements whose execution duration is greater than or equal to one second. | |
long_query_3s | The number of SQL statements whose execution duration is greater than or equal to three seconds. | |
long_idle_in_transaction_3s | The number of transactions that are idle for three seconds or longer. | |
long_idle_in_transaction_5s | The number of transactions that are idle for five seconds or longer. | |
long_idle_in_transaction_1s | The number of transactions that are idle for one second or longer. | |
long_2pc_1s | The number of 2PC transactions that last for one second or longer. | |
long_2pc_5s | The number of 2PC transactions that last for five seconds or longer. | |
long_2pc_3s | The number of 2PC transactions that last for three seconds or longer. |
You can click the  icon to the right of a metric on a dashboard to view the description of the metric.