Database Autonomy Service (DAS) provides the performance trends feature for ApsaraDB RDS for PostgreSQL. This feature lets you query data over a specified time range, perform multi-dimensional comparative analysis, and view custom combinations of metrics.
Introduction
In Performance Trend, you can view the following metrics:
Metric classification | Metric |
Basic metrics | CPU utilization, memory usage, available memory percentage, available memory, space utilization, data disk space usage details, space usage, network traffic, data disk IOPS. |
Database metrics | Latency, 2PC, long-running transactions, slow queries, longest bloat duration, transactions per second, rows processed, Connections. |
View performance trends
Go to the Instances page. In the top navigation bar, select the region in which the RDS instance resides. Then, find the RDS instance and click the ID of the instance.
In the navigation pane on the left, choose .
On the Dashboard page:
Query monitoring metrics for a specific time period
Select a time range to view the corresponding monitoring metrics. You can query monitoring data from the last 30 days.

Enable real-time mode
Click the
 icon next to the time range selection box to enable real-time mode. In this mode, the system automatically refreshes the monitoring metrics every 5 seconds. This lets you view real-time changes in database performance.
Change the monitoring frequency
Set Data Granularity to view metric trends at different granularities, such as 5 seconds, 30 seconds, or 1 minute.
View descriptions of monitoring metrics
In a metric trend chart, click the
 icon next to a metric to view its sub-metrics and their descriptions.
Switch nodes
For an ApsaraDB RDS for PostgreSQL Cluster Edition instance, you can select one or more nodes. This lets you compare metrics across different nodes.
NoteOn the Dashboard page, click the Previous Version button in the upper-right corner to return to the previous version of Performance Trends.
Appendix: Previous version of Performance Trend
Log on to the ApsaraDB RDS console and go to the Instances page. In the top navigation bar, select the region in which the RDS instance resides. Then, find the RDS instance and click the instance ID.
In the navigation pane on the left, choose .
In the upper-right corner of the Dashboard page, click Previous Version.
On the Performance Trends page, you can view the performance trends of metrics within the selected time range.
Click More Metrics to select the metrics whose performance trends you want to view.
NoteClick the
icon next to each metric to view its sub-metrics.Select the event levels to display. When an event of a selected level is detected, the system displays the event in the CPU Utilization trend chart.
Click an event in the trend chart to view its diagnostic results in the event list.
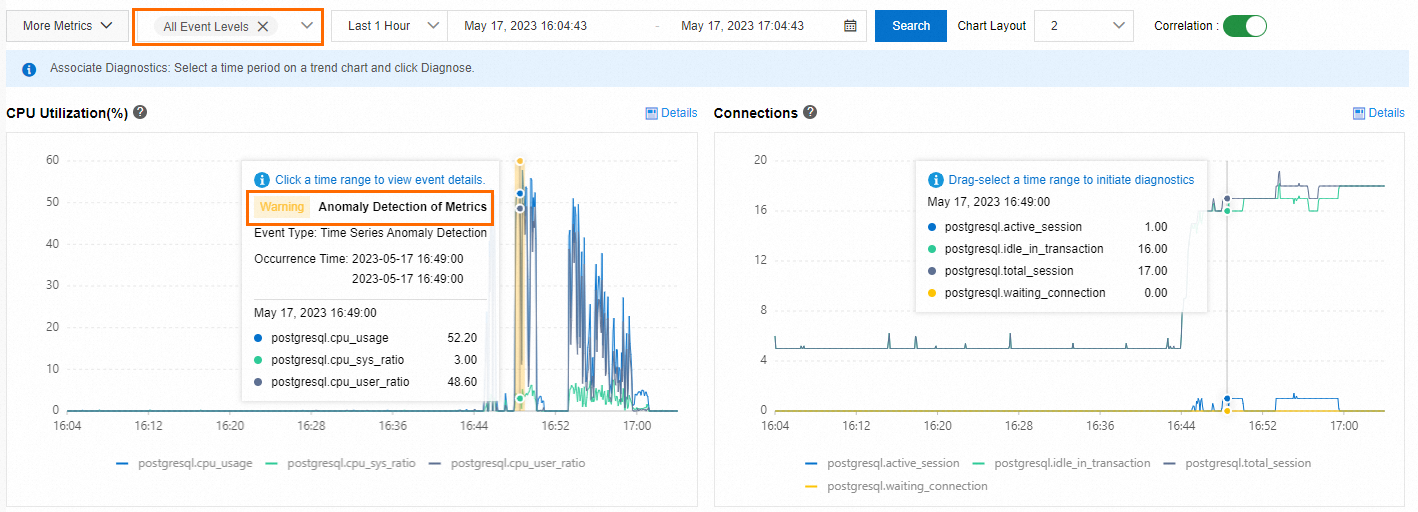
In any metric trend chart, drag the mouse to select a time period. Then, you can run a Diagnose on the selected period.
Click Details in a metric trend chart to zoom in on the chart. You can also change the time range to view the trend of the metric over different periods.
On the Performance Trend Comparison page, you can compare the performance trends of the same metrics across different time periods.
Click More Metrics to select the metrics for which you want to compare performance trends.
On the Custom Charts page, you can create multiple custom performance dashboards. You can display multiple performance monitoring metrics in the same chart to facilitate troubleshooting and analysis.
Click Add Monitoring Dashboard, enter a Dashboard Name, and then click OK.
Click Add Node and Metrics, select the target nodes and metrics, and then click
 .
.Click OK.