The Application Real-Time Monitoring Service (ARMS) console allows you to view the dashboards of Alibaba Cloud Container Service for Kubernetes (ACK), Elastic Compute Service (ECS) on a virtual private cloud (VPC), and other cloud services.
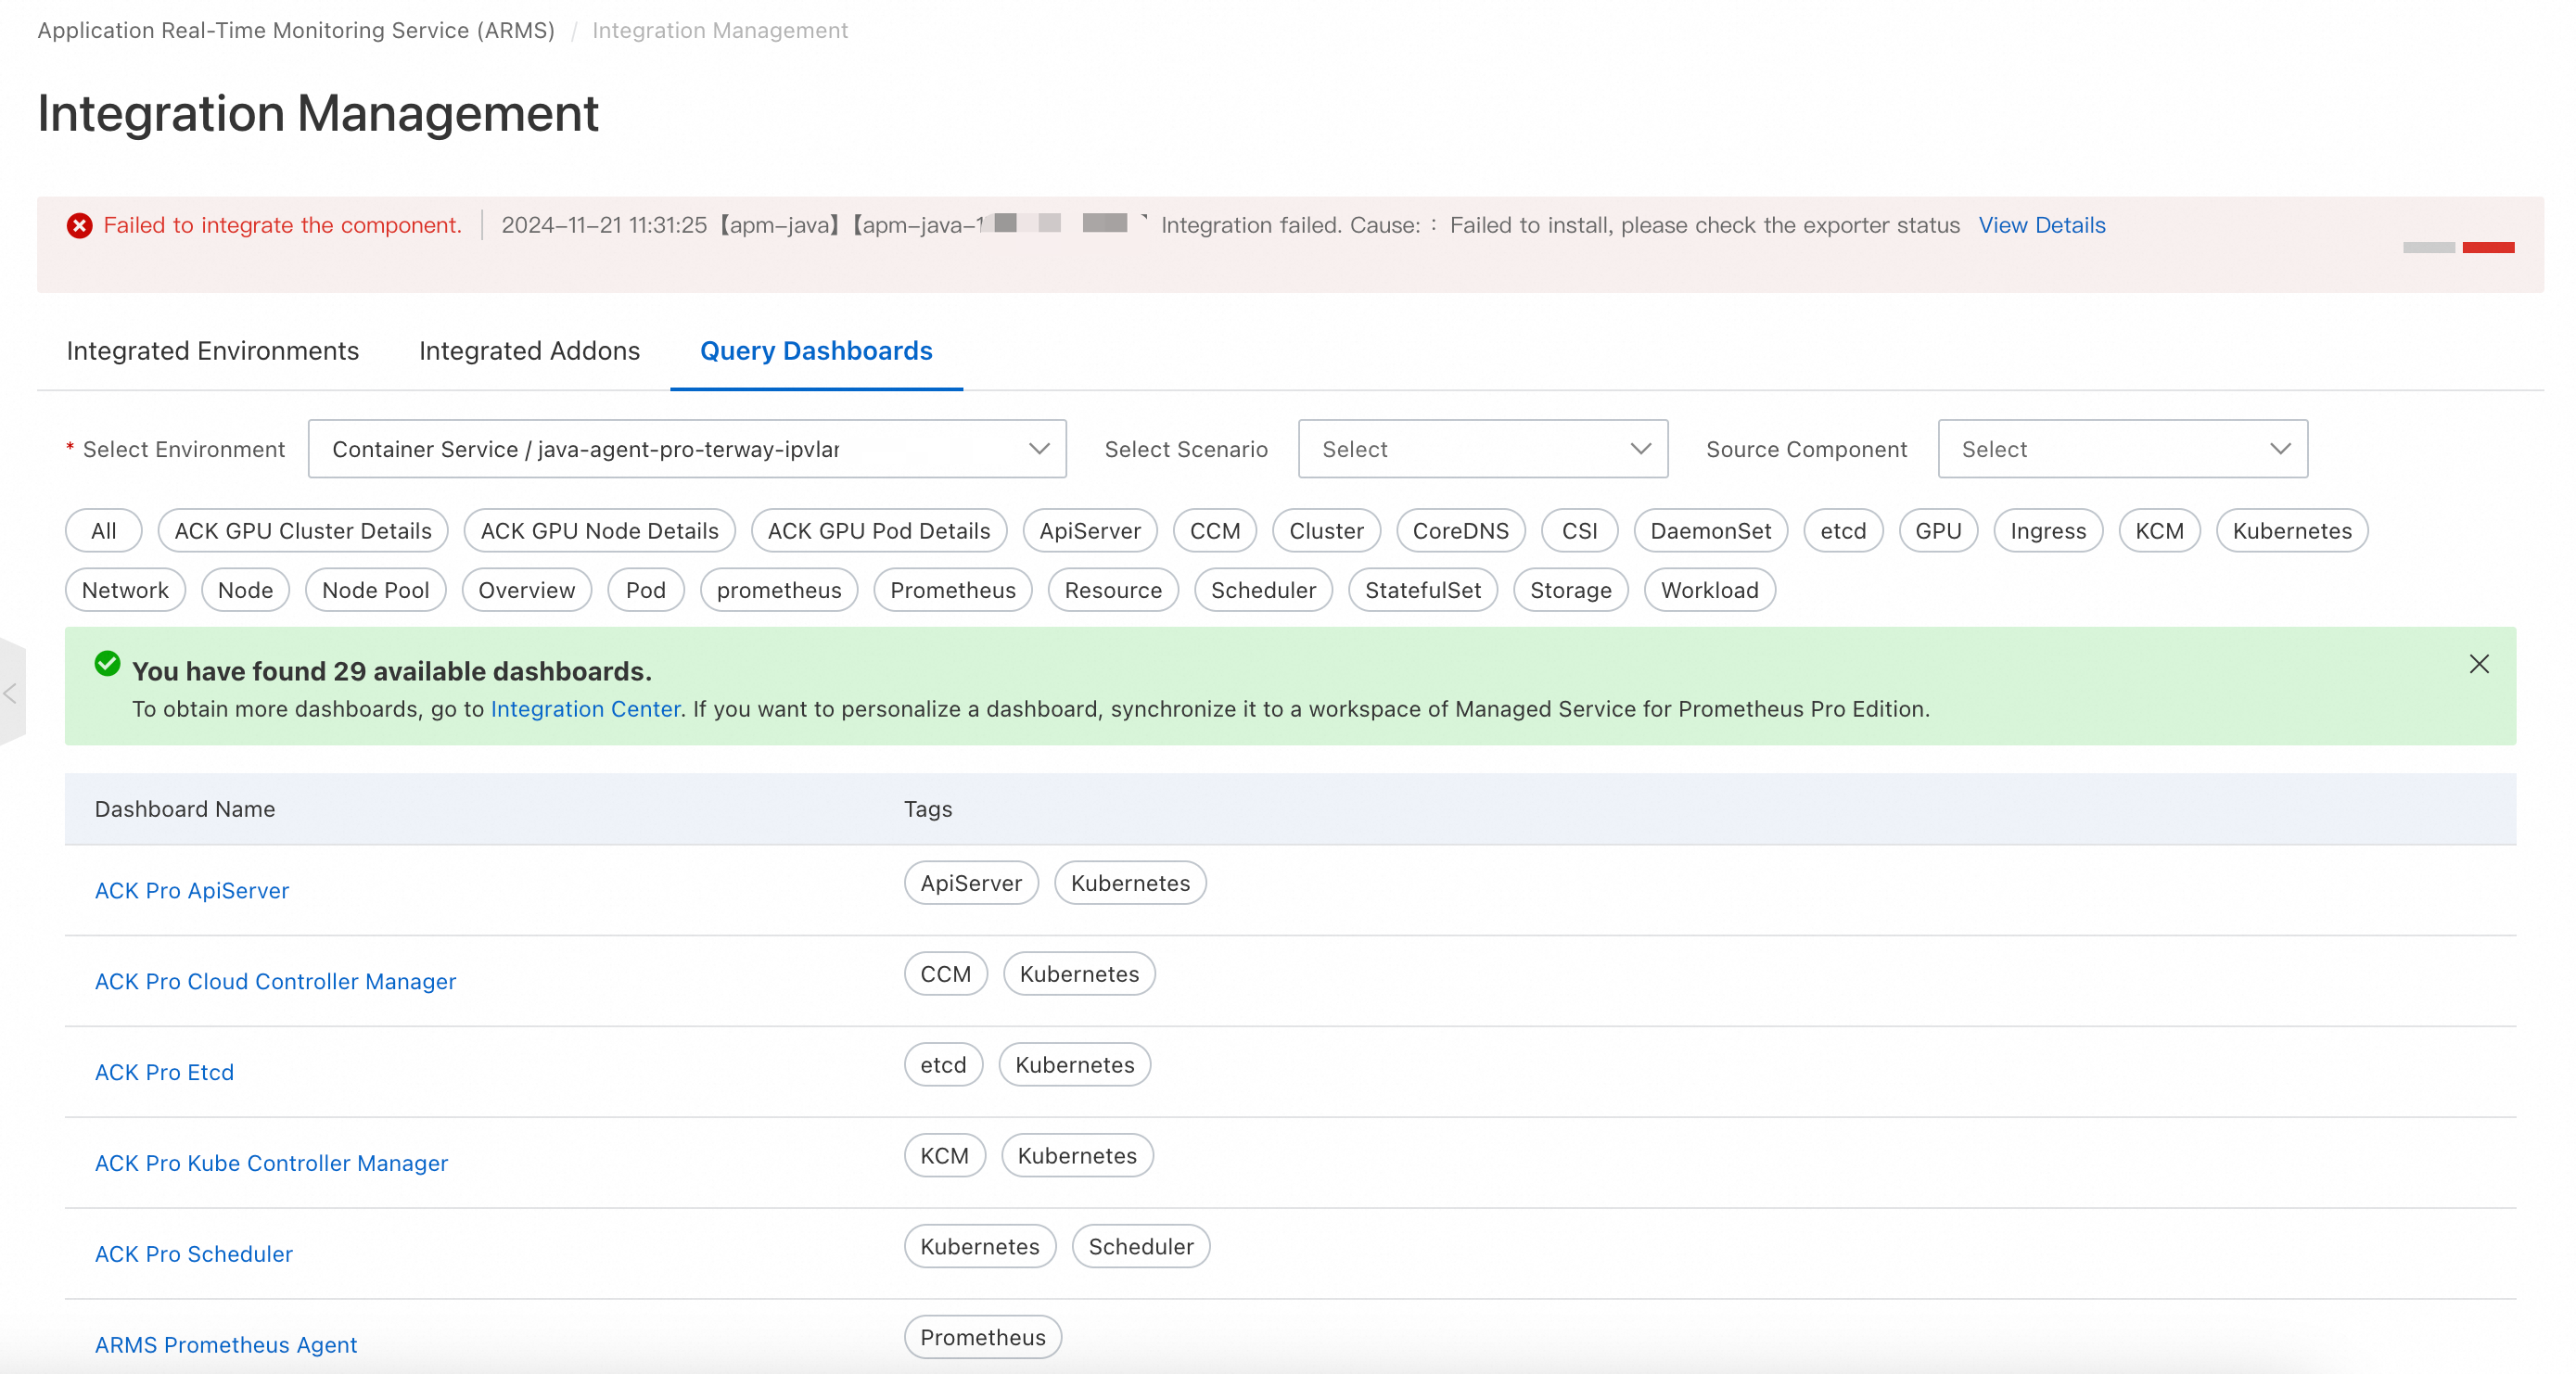
The Managed Service for Prometheus also allows you to query metrics in many scenarios, such as querying data in the console, retrieving data by using the Prometheus HTTP API, configuring Prometheus data sources in self-managed Grafana, and configuring the remote read endpoint in self-managed Prometheus.
