After data is reported to Tracing Analysis, the components of Tracing Analysis perform aggregate computing on the data in real time. Generally, the result is available with a specific latency. If you want to view the real-time diagnostics result during troubleshooting, you can use the real-time diagnostics feature.
Background information
- When you use the real-time diagnostics feature, a temporary storage mechanism is enabled. After data is reported, the diagnostics result is displayed without the need of real-time statistics.
- The real-time diagnostics feature does not affect normal statistics. This feature is automatically disabled after five minutes. After the feature is disabled, you can enable the feature again.
- By default, the real-time diagnostics page is refreshed at intervals of 10 seconds. You can also disable the scheduled refresh feature.
View trace information
- On the Applications page, select a region in the top navigation bar and click the name of the application
that you want to manage. Note If the
 icon is displayed in the Language column, the application is connected to Application Monitoring. If a hyphen (-) is displayed, the application is connected to Tracing Analysis.
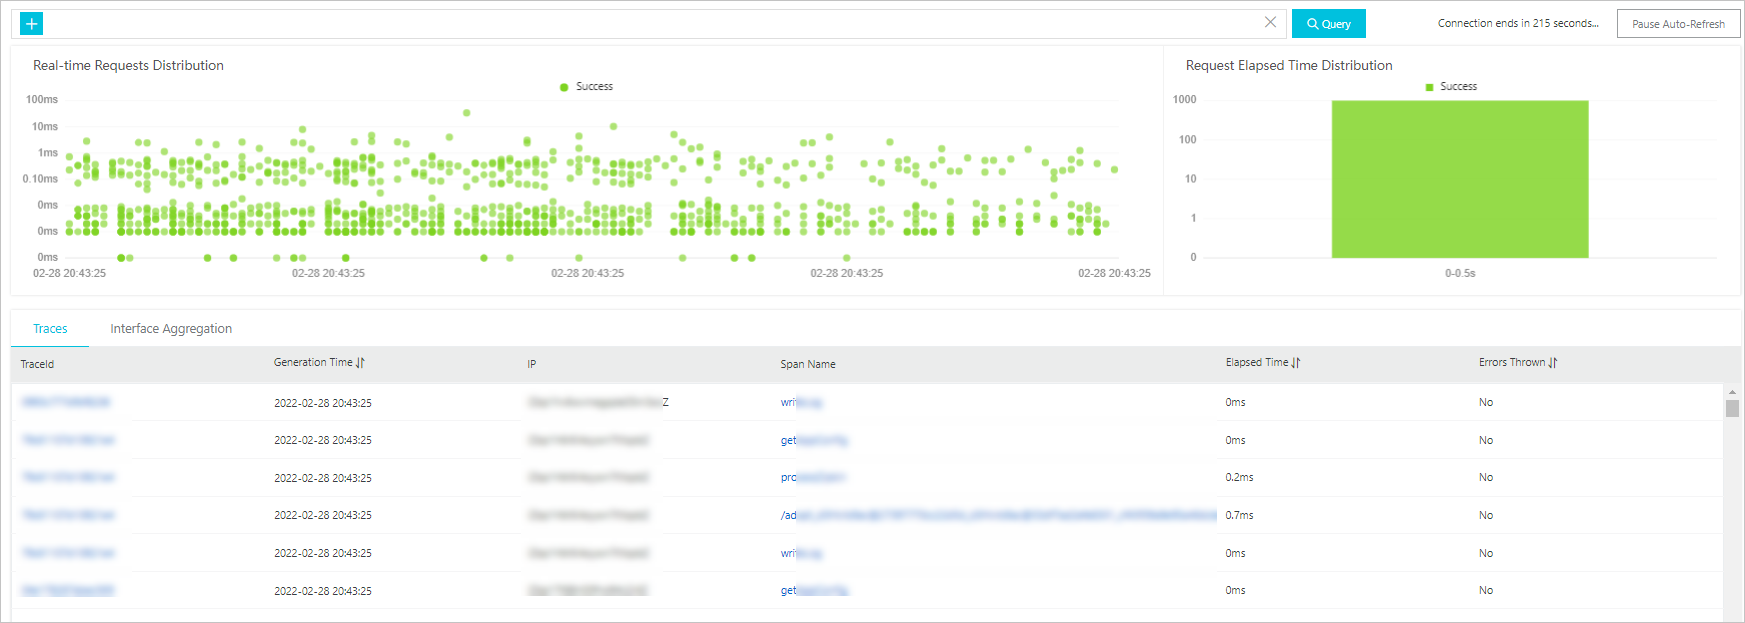
- Click Query to view the following trace information that is obtained based on the specified filters:
- The bitmap of the response time distribution of real-time requests
Note You can box-select an area on the bitmap to obtain the real-time diagnostics result of this area.
- The chart that shows the number of requests and the elapsed time distribution of requests
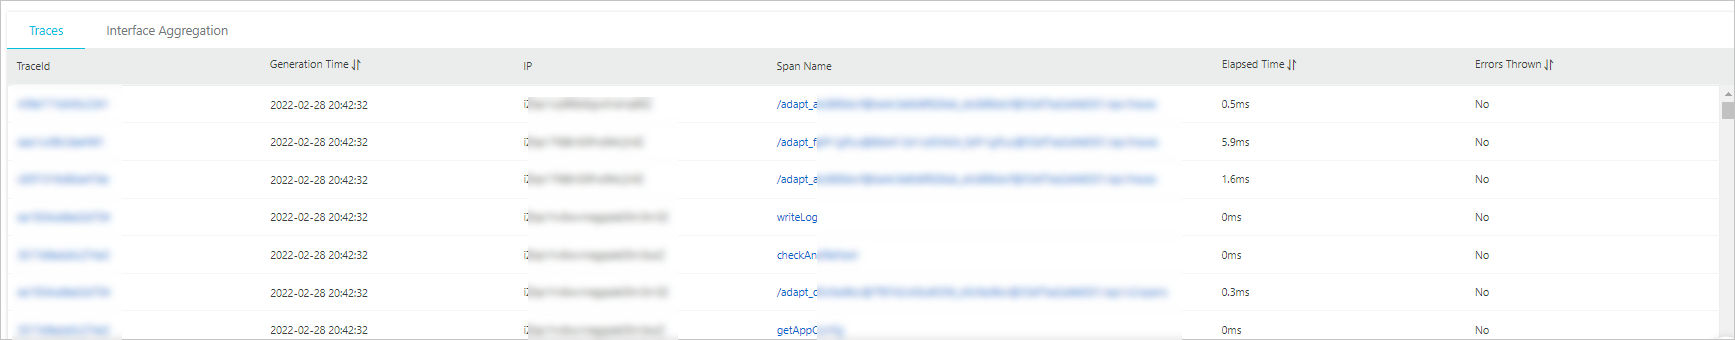
- The list of traces
- The bitmap of the response time distribution of real-time requests
View the waterfall chart of a trace
The Traces tab displays the span name, timeline chart, application name, start time, server IP address, and status of each trace.
Note The IP Address column may display IP addresses or server names. The information displayed depends
on the display settings that are configured on the Application Settings page. For more information, see Manage applications and tags.

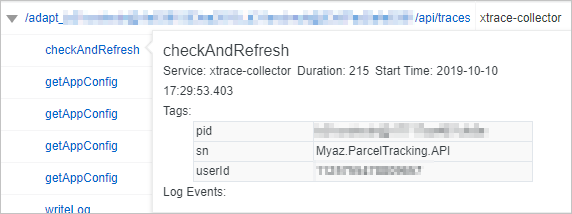
- Optional:On the Traces tab, perform the following operations:Move the pointer over the name of a span to view the information about the span, including the duration, start time, tags, and log events.
View the list of aggregated traces
Click the Interface Aggregation tab to view the list of traces that are aggregated based on the span name.