Trace Explorer provides three ways to query traces: a search bar for expression-based queries, a filter panel for structured filtering, and a quick filter pane for common dimensions. Combine these methods to locate specific traces.
Trace Explorer uses Simple Log Service (SLS) query syntax. If you already use SLS, the same query expressions work here. Analysis statements are not supported.
For a full list of searchable fields, see Trace Explorer parameters.
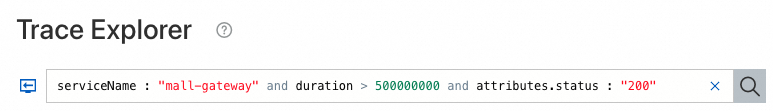
Search bar
Enter a query expression directly in the search bar on the Trace Explorer page.
Query syntax
Build expressions using field names, operators, and values. Combine multiple conditions with and or or.
Basic format: <field> <operator> <value>
Example: serviceName : "my-service" and duration >= 1000000000
Duration values
Duration is specified in nanoseconds. Use the following conversion table to set values correctly:
| Duration | Nanoseconds |
|---|---|
| 1 ms | 1,000,000 |
| 10 ms | 10,000,000 |
| 100 ms | 100,000,000 |
| 500 ms | 500,000,000 |
| 1 s | 1,000,000,000 |
| 5 s | 5,000,000,000 |
Examples:
Traces longer than 500 ms:
duration >= 500000000Traces between 0 and 500 ms (left-closed, right-open interval):
duration in (0 500000000)
Attribute and resource fields
To query fields under Attributes or Resources, prefix the field name with attributes. or resources..
attributes.http.status_code : 500resources.service.namespace : "production"
Top-level fields such as serviceName, spanName, and duration do not require a prefix.
Wildcard search
To use the wildcard characters * and ? in expressions, select Allow Fuzzy Search.
Query examples
| Scenario | Expression |
|---|---|
| HTTP 500 errors on a specific endpoint | spanName : "/components/api/v1/ads/data" and attributes.http.status_code : 500 |
| Exceptions from a specific service | serviceName : "opentelemetry-demo-adservice" and attributes.excep.ids : * |
| Traces longer than 1 s from a specific service | serviceName : "my-service" and duration >= 1000000000 |
| Slow traces on a specific endpoint | spanName : "/api/checkout" and duration >= 500000000 |
Filter panel
Click the search bar on the Trace Explorer page to open the drop-down filter panel. Build queries without writing expressions manually.
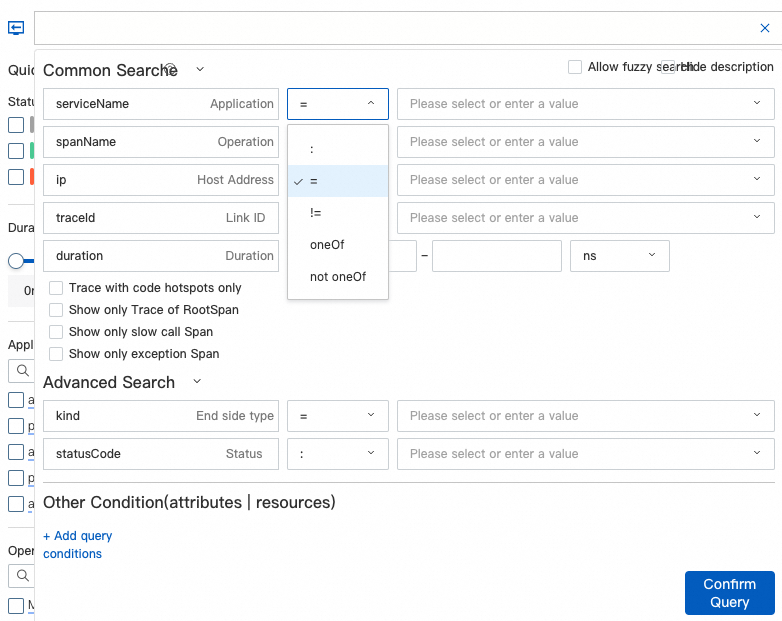
Filter operators
Select a filter condition from the drop-down list, then choose an operator and specify a value.
| Operator | Purpose | Example |
|---|---|---|
| oneOf | Match any of the specified values | Status is one of 200, 201, 204 |
| not oneOf | Exclude the specified values | Status is not 500, 502, 503 |
Custom attribute and resource filters
Click + Add Query Condition to filter by Attributes or Resources fields not in the default list.
Duration values in the filter panel also use nanoseconds.
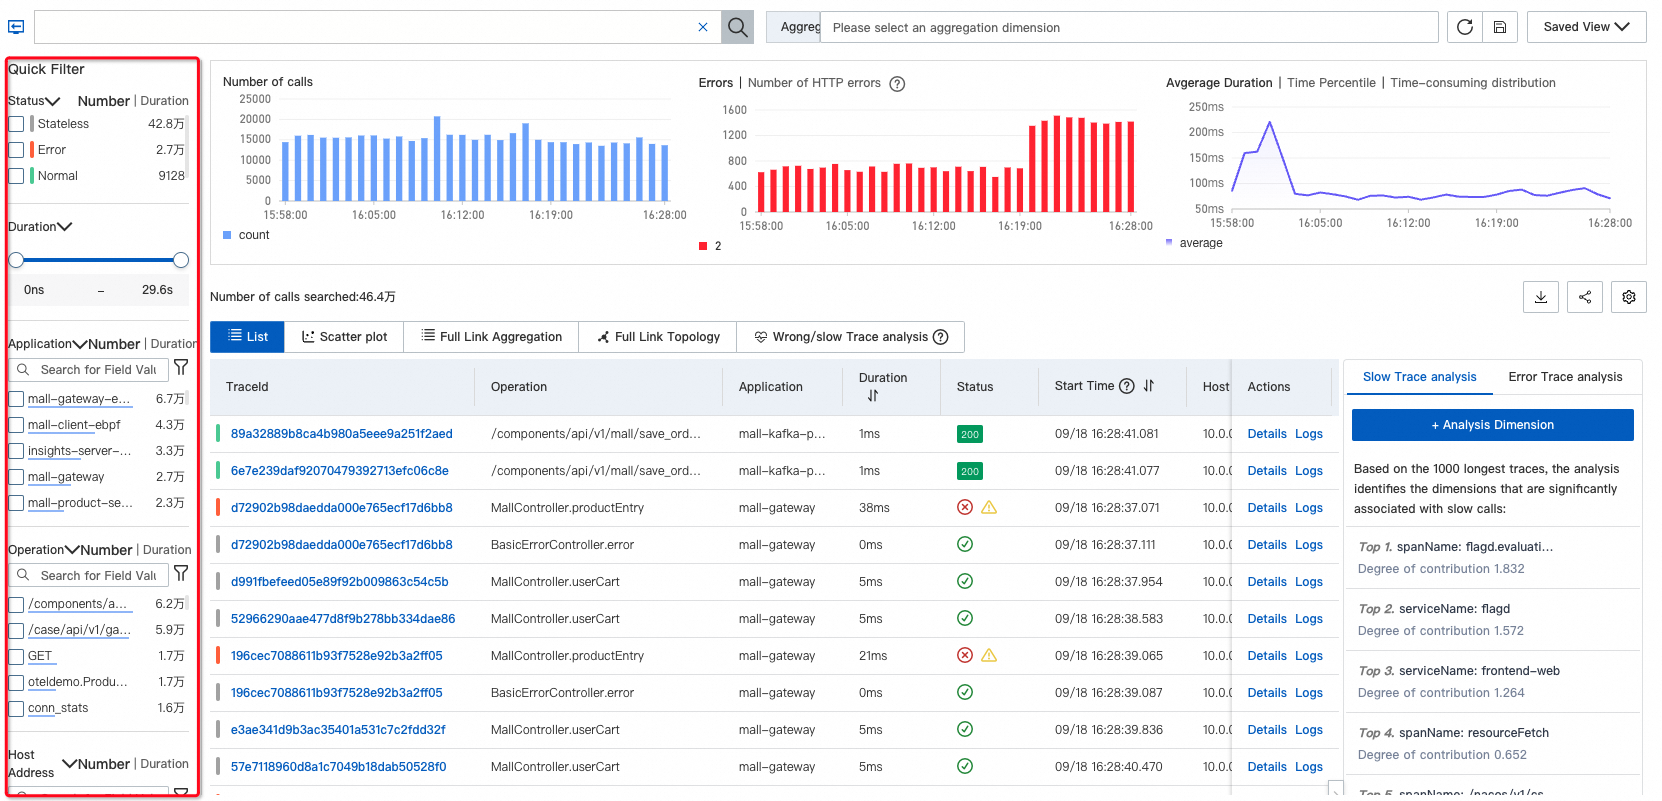
Quick filter pane
The Quick Filter pane on the left side of the Trace Explorer page provides one-click filtering:
| Dimension | Description |
|---|---|
| Status | Filter by trace status. Set the value to Error to display only error traces. |
| Duration | Filter by response time range. |
| Application name | Narrow results to a specific application. |
| Span name | Filter by operation or endpoint name. |
| Host address | Filter by the host where the span was recorded. |
Select values in one dimension to refine results, then apply additional dimensions for multi-level filtering. Results update in real time.
Related topics
Trace Explorer -- View and analyze query results.
Trace Explorer parameters -- Full field reference for query expressions.
SLS query syntax -- Complete operator and syntax reference.