Tracing Analysis tracks requests as they flow through distributed systems. This topic explains the core concepts and terminology for instrumenting your application.
Tracing Analysis uses the OpenTracing data model. OpenTracing has been archived and merged into OpenTelemetry. The concepts below still apply -- OpenTelemetry renames some fields but preserves the same underlying model.
Quick reference
| Concept | Definition |
|---|---|
| Trace | A directed acyclic graph (DAG) of spans representing the execution process of a transaction or process |
| Span | A single named, timed operation within a trace |
| SpanContext | Metadata (trace ID, span ID, baggage items) propagated across process boundaries |
| Reference | A causal link between two spans -- either ChildOf or FollowsFrom |
| Tracer | The interface that creates spans and propagates context via Inject and Extract |
| Carrier | The transport object (for example, an HTTP header map) that propagates SpanContext between services |
| Baggage items | Key-value pairs attached to a SpanContext and transmitted across process boundaries |
Why distributed tracing matters
To cope with various complex business requirements, developers adopt methods such as agile development and continuous integration. System architecture has evolved from standalone large-scale software to a microservice architecture, where a single user request can touch dozens of services. Each service may be written in a different language, maintained by a different team, and deployed on different infrastructure. When a service fails, dozens of downstream applications may encounter exceptions.
A distributed tracing system records request information, including the execution process and latency of each remote method call. This data is essential for troubleshooting system issues and analyzing system performance.
Traces and spans
A trace represents the execution process of a transaction or process in a distributed system. Each trace is a directed acyclic graph (DAG) made up of spans.
A span represents a named and timed segment that is continuously run in the trace. Spans connect through parent-child relationships to form the trace.
Example: a distributed call
When a client sends a request, the call might flow like this:
The request arrives at a load balancer.
The load balancer forwards it to an authentication service and a billing service.
These services access the required resources.
The system returns a result to the client.
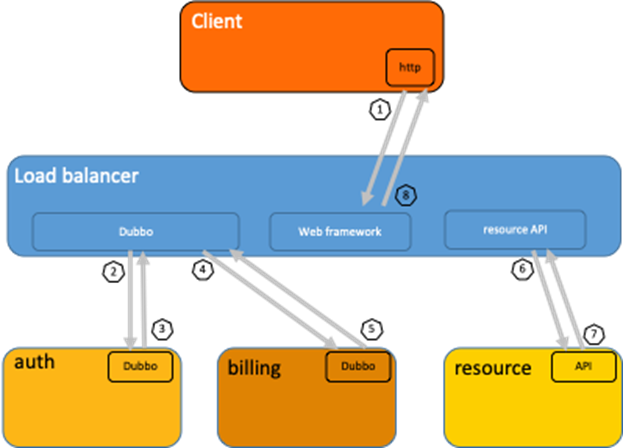
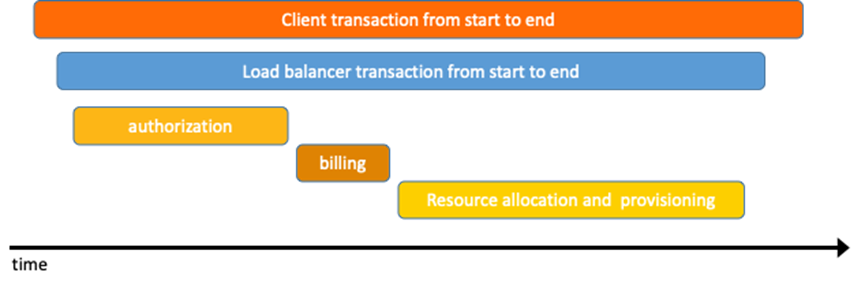
A tracing system records every step as a span and assembles them into a trace. The trace is typically displayed as a timeline:
OpenTracing data model
Span relationships
In the OpenTracing model, spans form a DAG through references. Two reference types exist:
| Reference type | Meaning | Example |
|---|---|---|
| ChildOf | The parent span depends on the result of the child span | A gateway span that waits for an auth check span to complete |
| FollowsFrom | The child span is causally related to the parent, but the parent does not wait for its result | A logging span triggered after a request span finishes |
The following trace contains eight spans (A through H) that illustrate both reference types:
Causal relationships among spans in a single trace


        [Span A]  <<<(root span)
            |
     +------+------+
     |             |
 [Span B]      [Span C] <<<(ChildOf: Span C is a child of Span A)
     |             |
 [Span D]      +---+-------+
               |           |
           [Span E]    [Span F] >>> [Span G] >>> [Span H]
                                       ^
                                       |
                         (FollowsFrom: Span G follows Span F)
Here is the same trace as a timeline, showing how spans overlap:
Time relationships among spans in a single trace


--|-------|-------|-------|-------|-------|-------|-------|-> time

 [Span A***************************************************]
   [Span B**********************************************]
      [Span D******************************************]
    [Span C****************************************]
         [Span E*******]        [Span F**] [Span G**] [Span H**]
Reading the diagrams:
Span A is the root span -- it has no parent and represents the entire trace duration.
Span B and Span C are children of Span A (ChildOf). They run in parallel.
Span D is a child of Span B.
Span E is a child of Span C.
Span F is also a child of Span C. Span G follows Span F (FollowsFrom), and Span H follows Span G.
What a span contains
Each span carries the following fields:
| Field | Type | Description |
|---|---|---|
| Operation name | String | A human-readable label for the operation, also called the span name |
| Start timestamp | Timestamp | When the operation started |
| Finish timestamp | Timestamp | When the operation ended |
| Tags | Key-value pairs (key: string; value: string, Boolean, or numeric) | Metadata that describes the span, such as http.method: GET |
| Logs | Key-value pairs + timestamp (key: string; value: any type) | Timestamped event records during the span, such as an error message |
| SpanContext | Object | Carries the trace ID, span ID, and baggage items across process boundaries |
| References | List of SpanContexts | Zero or more links to causally related spans (ChildOf or FollowsFrom) |
The following JSON shows what a typical span looks like in practice:
{
  "operationName": "/api/v1/order",
  "context": {
    "traceId": "7bba9f33312b3dbb8b2c2c62bb7abe2d",
    "spanId": "086e83747d0e381e"
  },
  "parentId": "",
  "startTime": "2025-06-15T08:30:01.209Z",
  "endTime": "2025-06-15T08:30:01.512Z",
  "tags": {
    "http.method": "POST",
    "http.status_code": 200,
    "component": "net/http"
  },
  "logs": [
    {
      "timestamp": "2025-06-15T08:30:01.305Z",
      "fields": { "event": "order.validated" }
    }
  ]
}
This is a root span -- it has a traceId and spanId but an empty parentId. A child span would carry the parent's spanId as its parentId.
OpenTelemetry uses different names for some of these fields. Tags are called attributes, and span logs are called span events. The underlying concepts are the same.
Tracer interface
The Tracer interface exposes three core methods:
| Method | Signature | Purpose |
|---|---|---|
StartSpan | StartSpan(operationName string, opts ...StartSpanOption) Span | Create and start a new span, or set the properties of a span |
Inject | Inject(sm SpanContext, format interface{}, carrier interface{}) error | Serialize the SpanContext (trace ID, span ID, baggage items) into a carrier for propagation |
Extract | Extract(format interface{}, carrier interface{}) (SpanContext, error) | Deserialize the SpanContext from an incoming carrier |
Context propagation
To propagate trace context across process boundaries:
Extract the SpanContext from the incoming request carrier.
   carrier := opentracing.HTTPHeadersCarrier(httpReq.Header)
   clientContext, err := tracer.Extract(opentracing.HTTPHeaders, carrier)
Create a child span using the extracted context.
sp := tracer.StartSpan("GetFeed", opentracing.ChildOf(clientContext))Inject the SpanContext into the outgoing request carrier before calling the next service.
   carrier := opentracing.HTTPHeadersCarrier(httpReq.Header)
   err := tracer.Inject(sp.Context(), opentracing.HTTPHeaders, carrier)
Data reporting
Tracing Analysis supports two data reporting modes:
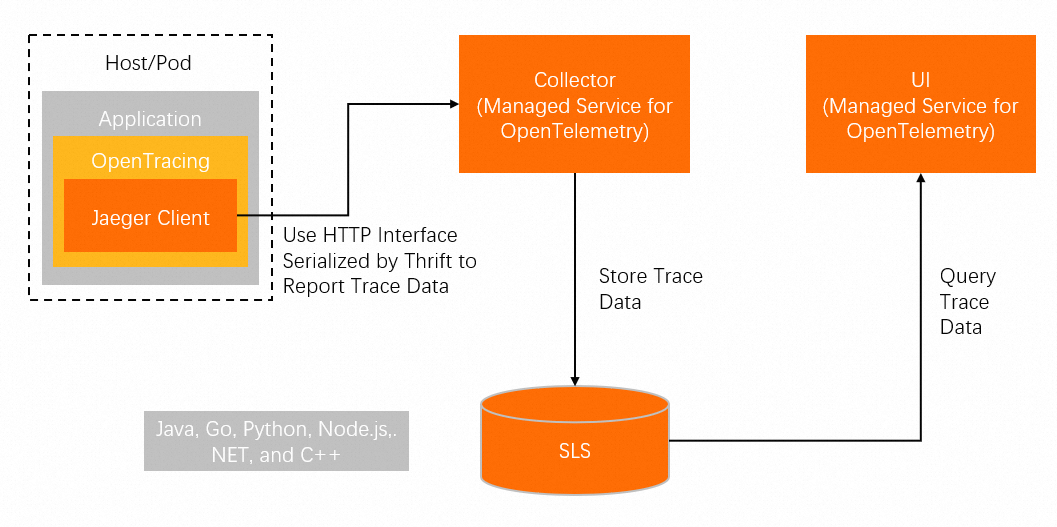
Direct reporting
The application sends trace data directly to the Tracing Analysis backend.
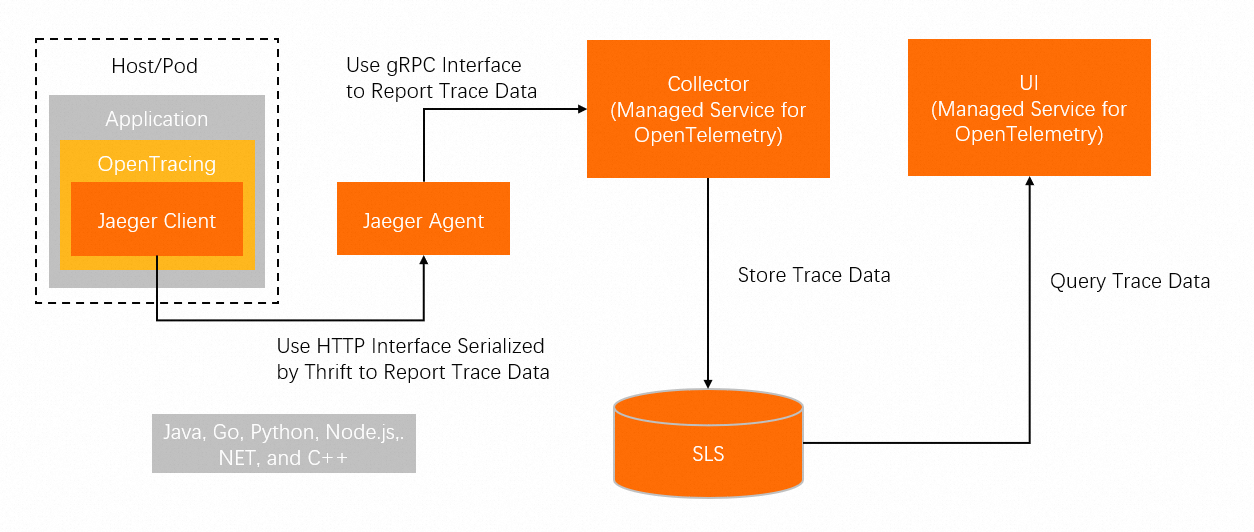
Reporting through an agent
The application sends trace data to a local agent (for example, Jaeger Agent), which forwards it to the Tracing Analysis backend.
OpenTracing to OpenTelemetry terminology mapping
OpenTracing has been archived and succeeded by OpenTelemetry. The following table maps OpenTracing terms used in this document to their OpenTelemetry equivalents:
| OpenTracing (used in this doc) | OpenTelemetry | Notes |
|---|---|---|
| Span tags | Attributes | Both support typed key-value pairs |
| Span logs | Span events | Timestamped records on a span |
| References (ChildOf, FollowsFrom) | Parent-child relationships (parentSpanId) and Span links | ChildOf maps to parent-child via parentSpanId; FollowsFrom maps to Span links |
| Baggage items | Baggage | Propagated across process boundaries |
What's next
Get started with Tracing Analysis to instrument your application.
Explore supported SDKs and integrations for your programming language.