When you manage Prometheus alert rules across multiple regions, configuring each instance individually creates redundant work and makes centralized management difficult. Alert rule templates in Managed Service for Prometheus let you define alerting logic once and deploy it to any number of Prometheus instances, keeping alert configurations consistent and reducing operational overhead.
How it works
Create a template -- Define alert conditions using a preset metric (static threshold) or a custom PromQL expression.
Apply the template -- Select one or more Prometheus instances and deploy the template to generate alert rules on each.
Manage at scale -- Update, enable, disable, or delete generated alert rules in bulk from the template.
Each template maintains a mapping to the alert rules it creates. This mapping controls how updates and deletions propagate:
| Scenario | Mapping retained | Mapping removed |
|---|---|---|
| Template reapplied with Update Created Alert Rules | Rule is overwritten with current template settings | Rule is unaffected |
| Template deleted with Delete Alert Rules Created from Template | Rule is deleted | Rule is unaffected |
| Rule edited independently | Future template updates overwrite edits | Rule becomes standalone; rename it to avoid name conflicts on next template application |
When you edit a rule created from a template, a dialog prompts you to retain or remove the mapping. Retain the mapping for centralized control. Remove it if the rule requires instance-specific customization that should not be overwritten.
Prerequisites
Before you begin, make sure that you have:
An Alibaba Cloud account with access to Application Real-Time Monitoring Service (ARMS)
At least one Prometheus instance in Managed Service for Prometheus
An alert contact group configured in ARMS
Create a template
Log on to the ARMS console.
In the left-side navigation pane, choose Managed Service for Prometheus > Prometheus Alert Rule Templates.
On the Prometheus Alert Rule Templates page, click Create Prometheus Alert Rule Template.
Set Check Type to one of the following:
Static Threshold -- Select a preset alert metric and define threshold-based conditions. Best for standard infrastructure metrics such as CPU utilization, memory usage, or disk capacity.
Custom PromQL -- Write a PromQL expression to monitor any metric, including those not available as presets. Best for multi-metric conditions or custom application metrics.
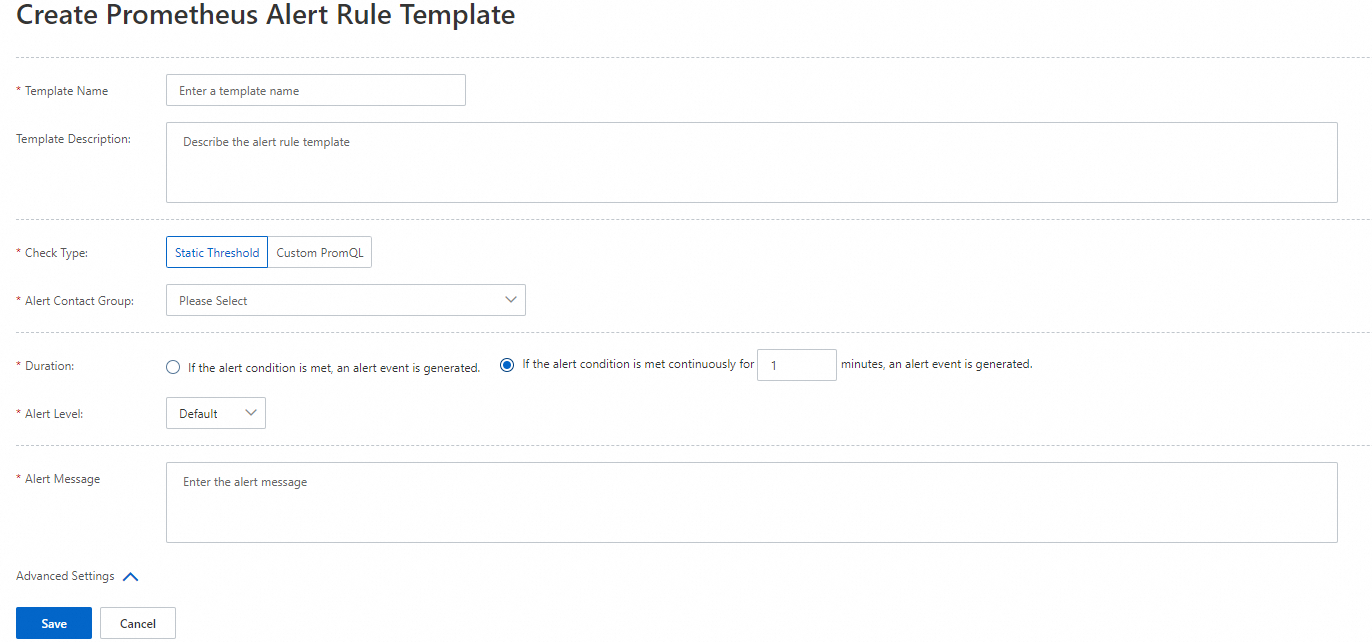
Configure the template parameters. See
Static threshold parameters orCustom PromQL parameters .Click OK.
Static threshold parameters
| Parameter | Description | Example |
|---|---|---|
| Template Name | A descriptive name for the template. | Production cluster - container CPU utilization alert |
| Template Description | (Optional) The purpose or scope of this template. | -- |
| Check Type | Select Static Threshold. | Static Threshold |
| Alert Contact Group | The contact group that receives alert notifications. Different groups provide different metric options. | Kubernetes load |
| Alert Metrics | The metric to monitor. Available metrics depend on the selected contact group. | Container CPU utilization |
| Alert Conditions | The threshold condition that triggers an alert event. | CPU utilization greater than 80% |
| Filter Conditions | The scope of resources the rule applies to. See | Instance IP Address: Traverse |
| Duration | How long the condition must persist before an alert fires. See | 1 |
| Alert Level | Severity level. Valid values: Default (lowest), P4, P3, P2, P1 (highest). | Default |
| Alert Message | The notification message content. Supports variables in Go template syntax. | Namespace: {{$labels.namespace}} / Pod: {{$labels.pod_name}} / Container: {{$labels.container}} CPU utilization: {{$labels.metrics_params_opt_label_value}} {{$labels.metrics_params_value}}%. Current value: {{ printf "%.2f" $value }}% |
| Tags | (Advanced) Key-value tags for matching notification policies. | -- |
| Annotations | (Advanced) Additional metadata for the alert rule. | -- |
Custom PromQL parameters
| Parameter | Description | Example |
|---|---|---|
| Template Name | A descriptive name for the template. | Pod CPU utilization exceeds 80% |
| Template Description | (Optional) The purpose or scope of this template. | -- |
| Check Type | Select Custom PromQL. | Custom PromQL |
| Custom PromQL Statement | A PromQL expression that defines the alert condition. | max(container_fs_usage_bytes{pod!="", namespace!="arms-prom",namespace!="monitoring"}) by (pod_name, namespace, device)/max(container_fs_limit_bytes{pod!=""}) by (pod_name,namespace, device) * 100 > 90 |
| Duration | How long the condition must persist before an alert fires. See | 1 |
| Alert Level | Severity level. Valid values: Default (lowest), P4, P3, P2, P1 (highest). | Default |
| Alert Message | The notification message content. Supports variables in Go template syntax. | Namespace: {{$labels.namespace}} / Pod: {{$labels.pod_name}} / The utilization of the {{$labels.device}} disk exceeds 90%. Current value: {{ printf "%.2f" $value }}% |
| Tags | (Advanced) Key-value tags for matching notification policies. | -- |
| Annotations | (Advanced) Additional metadata for the alert rule. | -- |
Filter condition types
Filter conditions control which resources the alert rule applies to within a Prometheus instance.
| Type | Behavior |
|---|---|
| Traverse (default) | Applies to all resources in the Prometheus instance. |
| Equal | Applies only to the resource with the specified name. Only one resource can be specified per rule. |
| Not equal | Applies to all resources except the one with the specified name. Only one resource can be specified per rule. |
| Regex match | Applies to all resources whose names match the specified regular expression. |
| Regex not match | Applies to all resources whose names do not match the specified regular expression. |
Duration options
| Option | Behavior |
|---|---|
| If the alert condition is met | An alert event fires immediately when a single data point reaches the threshold. |
| If the alert condition is continuously met for N minutes | An alert event fires only after the threshold is breached for at least N consecutive minutes. |
Apply a template to Prometheus instances
After you create a template, apply it to one or more Prometheus instances to generate alert rules automatically.
On the Prometheus Alert Rule Templates page, find the template and click Apply Template in the Actions column.
In the Application Template dialog box, on the Prometheus Instance Selection Mode tab, select one or more Prometheus instances and click OK.
NoteFilter instances by name, region, or type.
Choose whether to update existing alert rules and click OK.
ARMS uses the current template to create an alert rule for each selected Prometheus instance.
If you clear Update Created Alert Rules, any rules previously created from this template remain unchanged. The console displays: The alert rules are not updated because they are created from this template.
If you select Update Created Alert Rules, existing rules created from this template are overwritten with the current template settings.
ImportantIf a rule was manually modified but still mapped to this template, selecting Update Created Alert Rules overwrites those modifications. To prevent this, remove the mapping when you edit the rule. See
How it works for details on template-rule mapping.
View and manage rules created from a template
On the Prometheus Alert Rule Templates page, find the template and click View Alert Rules in the Actions column.
In the Alert Rules Created from Template dialog box, manage rules as needed:
Enable rules -- Select one or more rules and click Enable Alert Rules.
Disable rules -- Select one or more rules and click Disable Alert Rules.
Delete rules -- Select one or more rules and click Delete Alert Rules.
Delete a template
On the Prometheus Alert Rule Templates page, find the template and click Delete in the Actions column.
Choose whether to delete the associated alert rules and click OK.
If you select Delete Alert Rules Created from Template, all rules generated from this template are deleted. Rules that were previously unmapped (by selecting Remove the mapping between this alert rule and the alert rule template during an edit) are not affected.
If you clear Delete Alert Rules Created from Template, all generated rules are retained as standalone rules.