When you troubleshoot slow responses or failed requests, you need to trace the full execution path of individual API calls. The Interface Snapshot tab in Application Monitoring records the creation time, duration, and status of each request as it flows through your application, so you can pinpoint where latency or errors occur.
Prerequisites
Before you begin, make sure that:
Your application is monitored by Application Monitoring. For more information, see Overview
Open the Interface Snapshot tab
Log on to the ARMS console.
In the left-side navigation pane, choose Application Monitoring > Applications.
On the Applications page, select a region in the top navigation bar, then click the application name.
Note The icon in the Language column indicates the monitoring type. A icon means the application is connected to Application Monitoring. A hyphen (-) means it is connected to Tracing Analysis.
In the left-side navigation pane, click Application Details.
Select an application instance, set the time period, and click the Interface Snapshot tab.
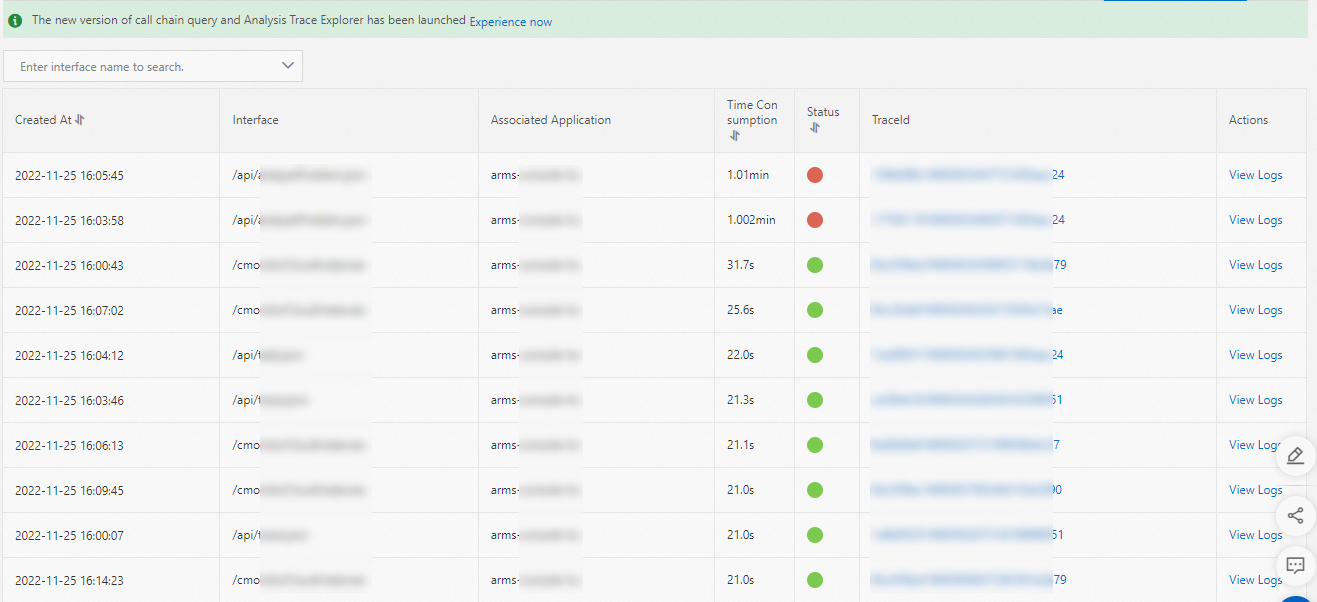
The Interface Snapshot tab lists every API called within the application during the selected time period.
Find and inspect traces
| Task | Action |
|---|---|
| Search by API name | Enter the API name in the search box and press Enter. All traces for that API are displayed. |
| View trace details | Click a trace ID in the TraceId column. For more information, see Supported operations. |
| View related logs | Click View Logs in the Actions column to open the business logs associated with that trace. |
Correlate traces with business logs
You must associate trace IDs with your application's business logs to jump from an error trace directly to the relevant log entries. After you configure this association, the View Logs action links each trace to its corresponding log records, which speeds up root cause analysis.
For setup instructions, see Associate trace IDs with business logs.