When JS errors spike in production, you need to quickly identify what broke, who is affected, and why. Application Real-Time Monitoring Service (ARMS) Browser Monitoring captures JavaScript (JS) errors from your web applications in real time. JS error diagnostics gives you the tools to:
Track error counts, error rates, and affected users at a glance
Drill into individual errors to inspect stack traces and pinpoint the source
Upload source map files to map minified stack traces back to your original code
Replay user behavior traces to see exactly what happened before an error
Break down error distribution by browser, OS, device, app version, and geography
Open the JS error diagnostics page
Log on to the ARMS console.
In the left-side navigation pane, choose .
On the Browser Monitoring page, select a region in the top navigation bar, then click the application name.
In the left-side navigation pane, choose .
On the JS error diagnosis page, set the time range in the upper-right corner to scope your analysis.
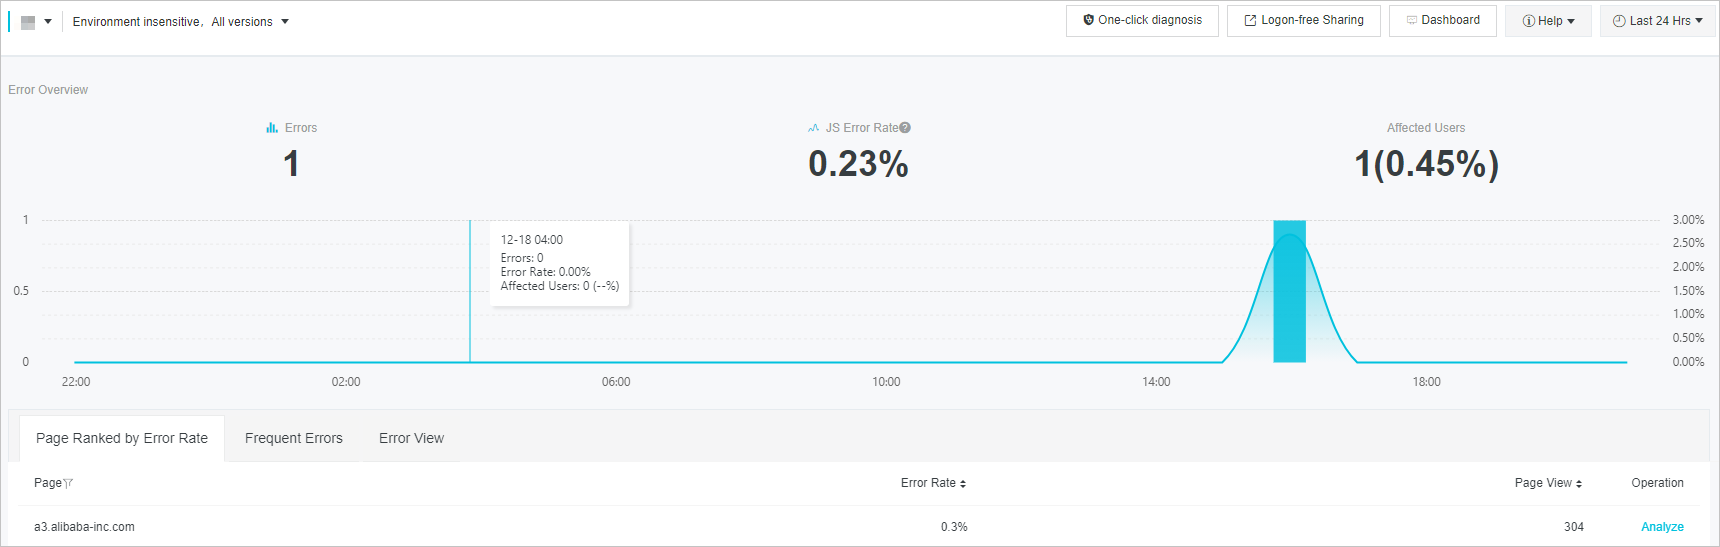
Error overview
The Error Overview section displays three key metrics for the selected time range:
| Metric | Description |
|---|---|
| Errors | Total number of JS errors |
| JS Error Rate | Ratio of page views (PVs) with JS errors to total PVs |
| Affected Users | Number and percentage of users who encountered JS errors |
Interact with the error trend chart
View data at a point in time -- Hover over the curve to see the error count, error rate, and affected user count at that moment.
Open Exception Insight -- Hover over a turning point on the curve until the pointer changes to a hand icon, then click. The Exception Insight dialog box opens. See Exception Insight for details.
Zoom in on a time range -- Click and drag to select an area on the chart. The view zooms in to show the selected range. Click Reset Zoom in the upper-right corner to restore the original view.
The Error Overview section shows the application-level overview by default. To view the error overview for a specific page, click Analyze on the Page Ranked by Error Rate tab or the Page Error Rate Top 5 tab in the Exception Insight dialog box.
Exception Insight
Click a turning point on the error trend chart to open the Exception Insight dialog box. This dialog provides a snapshot of JS errors at that specific moment:
| Metric | Description |
|---|---|
| Errors | Total JS errors at the selected time point |
| JS Error Rate | Ratio of PVs with JS errors to total PVs at the selected time point |
| Affected Users | Number and percentage of affected users |
| Frequent Errors Top 5 | The five most frequent JS errors, with error details, occurrence count, and affected users |
| Page Error Rate Top 5 | The five pages with the highest JS error rates, with page names, error rates, and PV counts |
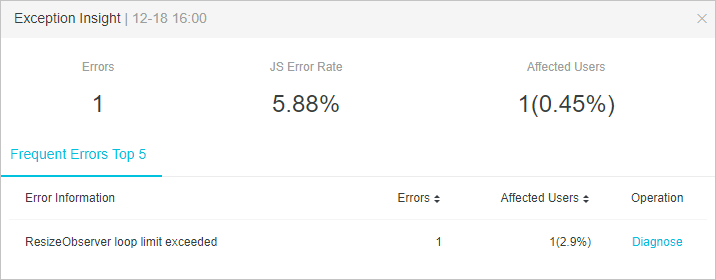
Available actions:
On the Frequent Errors Top 5 tab, click Diagnose in the Operation column to open the error details page. See Error details.
On the Page Error Rate Top 5 tab, click Analyze in the Operation column to view the error overview for that page.
Pages ranked by error rate
The Page Ranked by Error Rate tab lists pages sorted by JS error rate (highest first) for the selected time range:
| Column | Description |
|---|---|
| Page | The page where JS errors occurred |
| Error Rate | Ratio of PVs with JS errors to total PVs on that page |
| Page View | Total views of the page |
Click Analyze in the Operation column to view the error overview for a specific page.
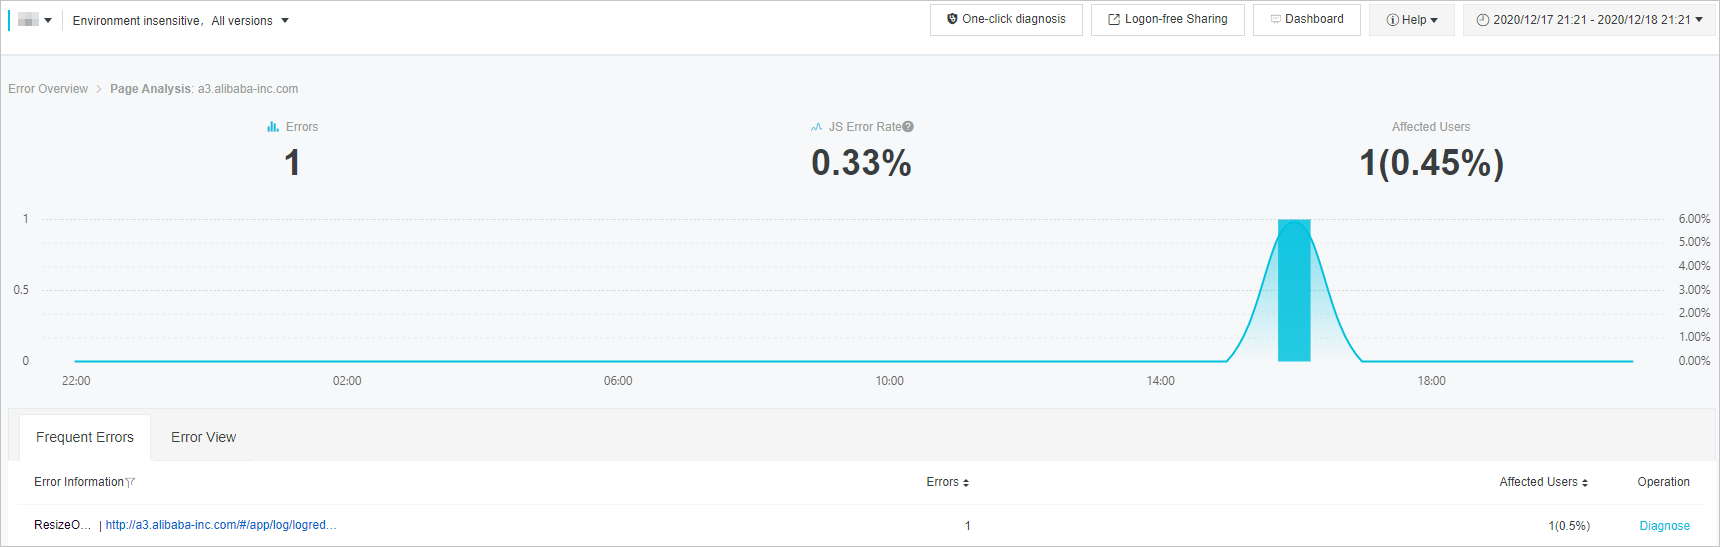
Frequent errors
The Frequent Errors tab lists JS errors sorted by occurrence count (highest first) for the selected time range:
| Column | Description |
|---|---|
| Error Information | JS error message captured by ARMS |
| Page | The page where the error occurred |
| Errors | Number of times the error occurred |
| Affected Users | Number and percentage of affected users |
Click Diagnose in the Operation column to open the error details page. See Error details.
The Frequent Errors tab shows application-level errors by default. To view errors for a specific page, click Analyze on the Page Ranked by Error Rate tab or the Page Error Rate Top 5 tab in the Exception Insight dialog box.
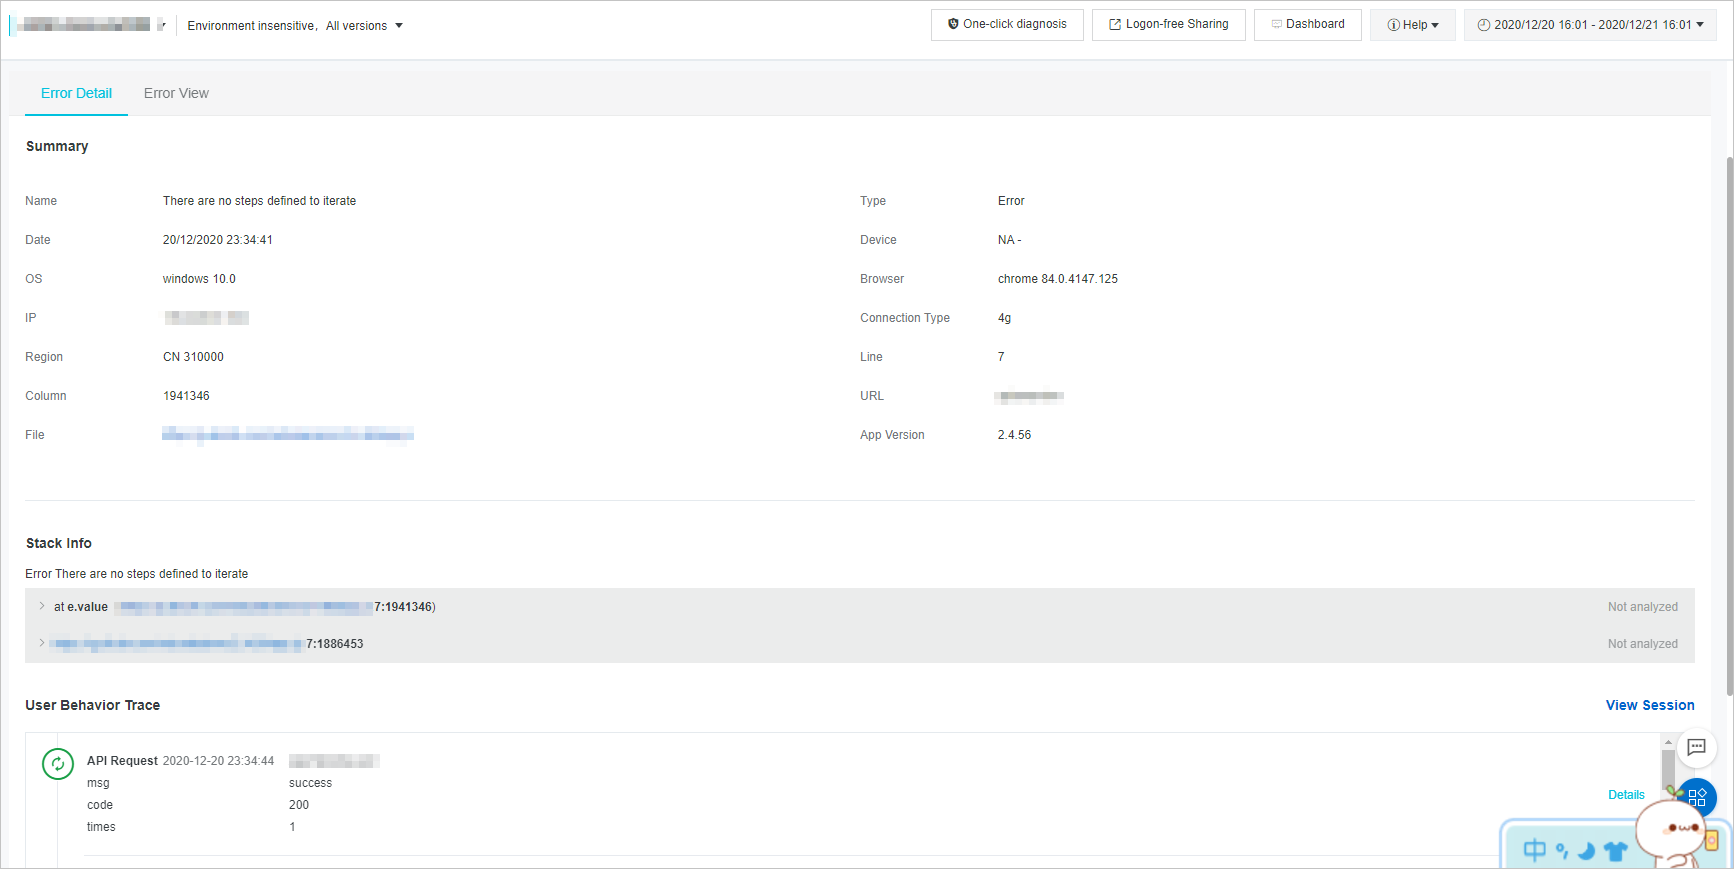
Error details
The Error Detail tab provides full context for a specific JS error.
Summary
The Summary section includes the following fields:
| Field | Description |
|---|---|
| Name | Error name |
| Type | Error type |
| Date | Timestamp when the error was detected |
| Device | Device type |
| OS | Operating system |
| Browser | Browser name and version |
| IP | Client IP address |
| Connection Type | Network connection type |
| Region | Geographic region |
| Line | Line number in the source file |
| Column | Column number in the source file |
| URL | Page URL where the error occurred |
| File | Path of the file that contains the error |
| App Version | Application version |
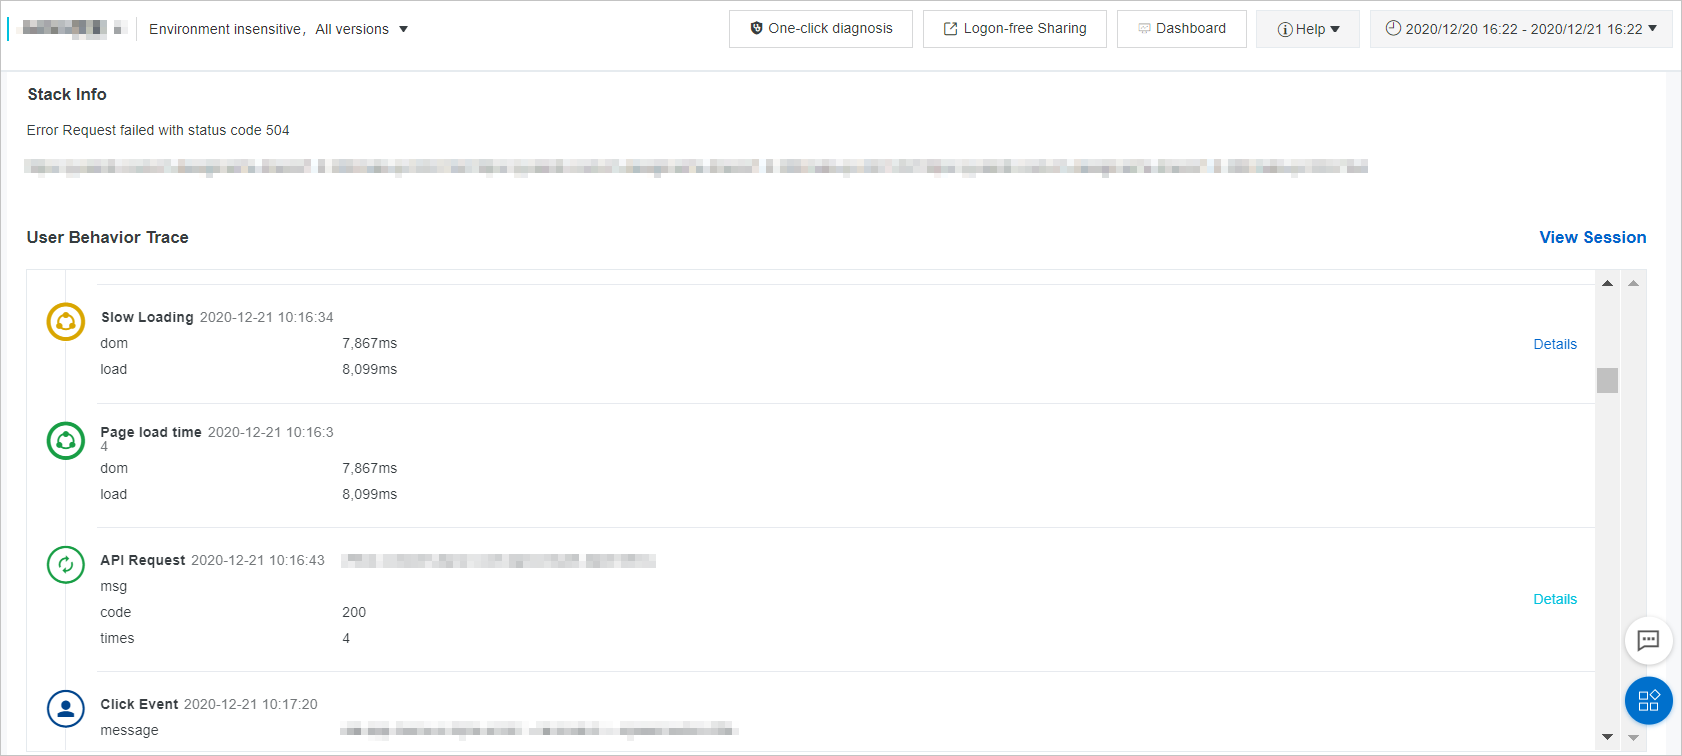
Stack trace
The Stack Info section displays the call stack at the time of the error. Use it to trace the error back to the exact function and line of code that failed.
Map minified stack traces with source maps
Minified or bundled JS files produce stack traces that are difficult to read. Upload a source map file to map these traces back to your original source code.
In the Stack Info section, click the triangle icon on the left side of a stack frame to expand it.
Click Choose Sourcemap.
In the Sourcemap File dialog box, select an existing source map file or upload a new one.
Click OK.
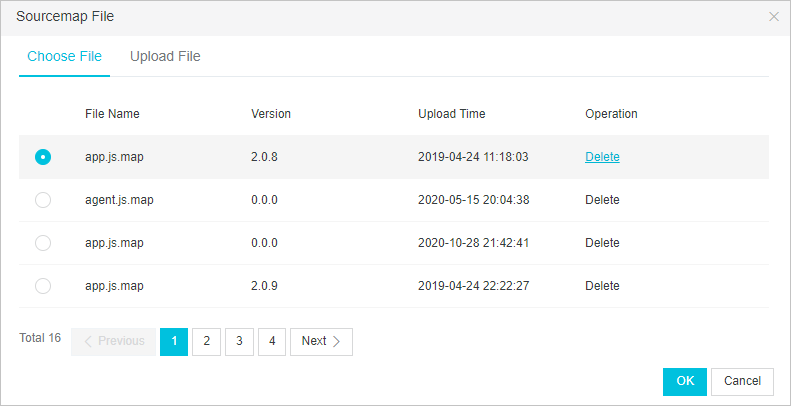
ARMS uses the source map file to resolve the minified stack trace to the exact file, function, and line in your original source code.
User behavior trace
The User Behavior Trace section records a timeline of user actions leading up to the error. Review this timeline to reconstruct the steps that triggered the error.
User behavior backtracking is enabled by default. To disable it, set behavior: false in the SDK configuration. For more information, see SDK reference.
Error distribution
Click the Error View tab to see how a specific JS error is distributed across different dimensions:
| View | Description |
|---|---|
| Time View | Error distribution over time (page-specific errors only) |
| Browser View | Distribution by browser type |
| OS View | Distribution by operating system |
| Device View | Distribution by device type |
| Version View | Distribution by app version |
| Geographical View | Distribution by location -- the China View tab shows data by province, municipality, or autonomous region; the World View tab shows data by country or region |
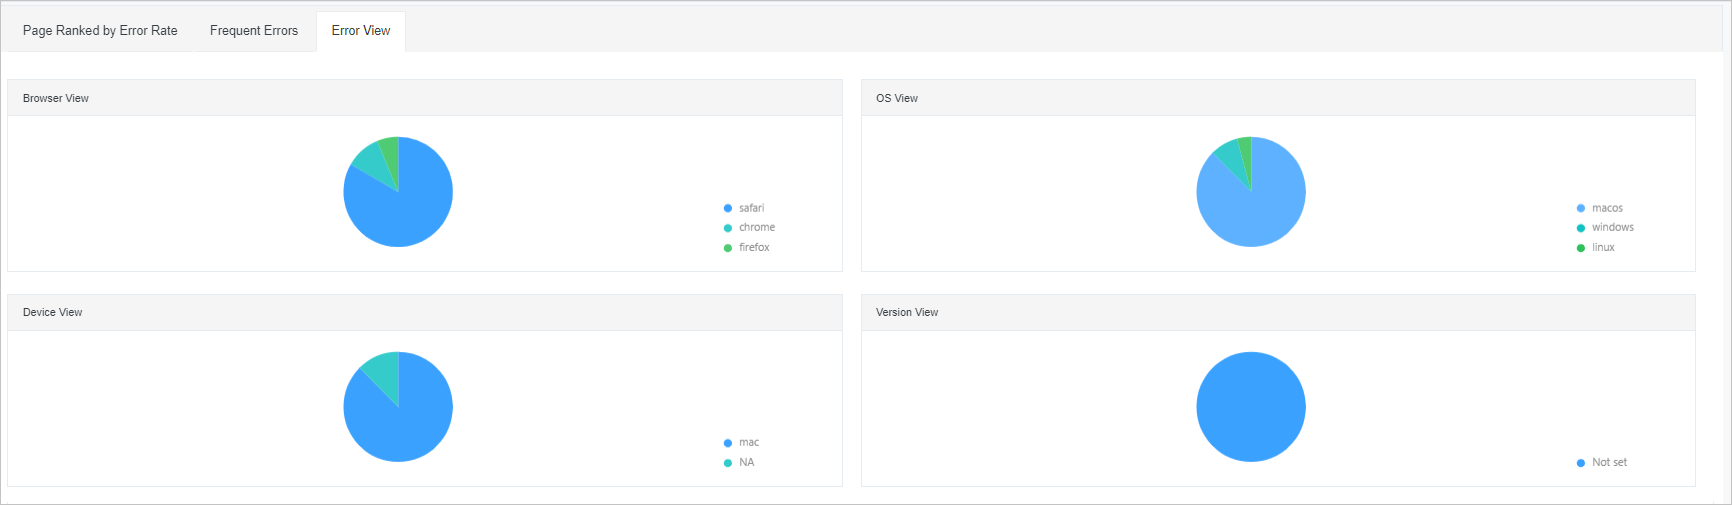
On the Error View tab:
In the Time View section, hover over the chart to see error counts at each time point.
In the Browser View, OS View, Device View, and Version View sections, hover over the chart to see error counts and percentages.
In the Geographical View section, on the China View or World View tab, click the arrows next to the Errors column header to sort by ascending or descending order.
FAQ
How do I enable or disable user behavior backtracking?
User behavior backtracking is enabled by default. To disable it, add behavior: false to the SDK configuration:
<script>
    !(function (c, b, d, a) {
        c[a] || (c[a] = {});
        c[a].config = {
            pid: "<your-pid>",
            imgUrl: "https://arms-retcode.aliyuncs.com/r.png?",
            sendResource: true,
            enableLinkTrace: true,
            behavior: false
        };
        with(b) with(body) with(insertBefore(createElement("script"), firstChild)) setAttribute("crossorigin", "", src = d)
    })(window, document, "https://retcode.alicdn.com/retcode/bl.js", "__bl");
</script>
Replace <your-pid> with your actual application PID.
For the full list of SDK configuration items, see SDK reference.
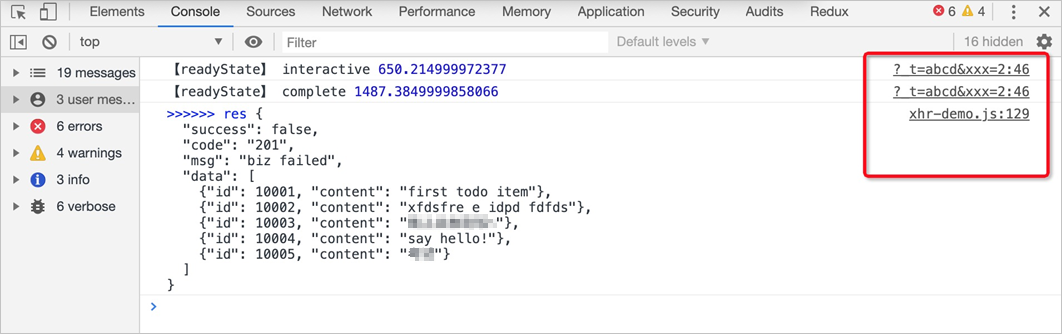
console.log shows errors in bl.js instead of my source code. How do I fix this?
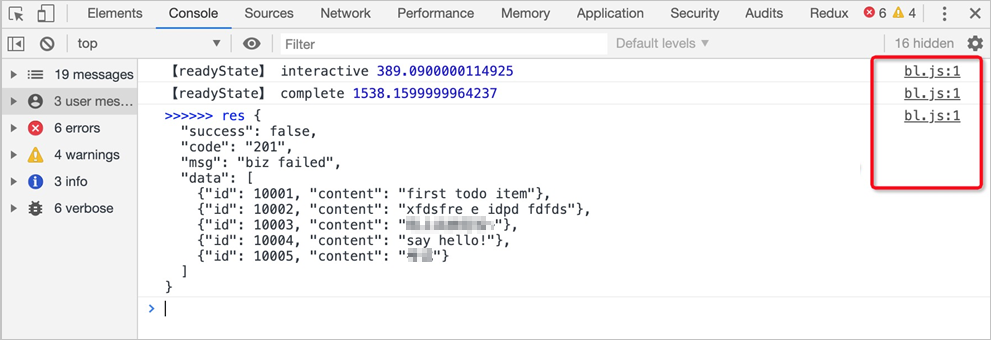
ARMS rewrites console.log to capture browser console output as part of user behavior tracking. This causes stack traces in the console to point to the ARMS SDK file (bl.js) rather than your application code.
Solution 1 (recommended): Set up blackboxing in Chrome DevTools
Open Chrome, press Ctrl+Shift+I to open Developer Tools, then click the Settings icon.
In the left-side navigation pane of the Settings panel, click Blackboxing.
Click Add pattern.
In the Pattern field, enter
/bl.*\.js$, then click Add.
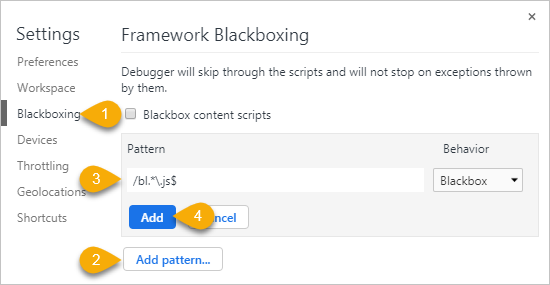
Chrome now skips bl.js frames in stack traces, showing your actual source code instead.
Solution 2: Disable user behavior backtracking
Set behavior: false in the SDK configuration to stop ARMS from rewriting console.log. See the previous FAQ for the configuration example.