CloudMonitor tracks metrics across Alibaba Cloud services and fires alerts when thresholds are breached. Integrate these alerts into Application Real-Time Monitoring Service (ARMS) Alert Management to centralize alert triage, deduplication, and notification routing across services.
How it works
CloudMonitor alerts reach ARMS through webhooks:
When you create an integration, ARMS generates a unique webhook URL.
CloudMonitor sends alert events to that URL each time a rule triggers or clears.
ARMS maps incoming fields to its own alert schema, deduplicates events, and routes notifications based on your policies.
If an alert event is not triggered again within the configured auto-recovery period, ARMS automatically clears it.
If you do not integrate alerts into Alert Management, the source systems handle alerts based on their own processing capabilities.
Choose an integration method
| Method | Best for | How it works |
|---|---|---|
| Service-level integration | Capturing all alerts from one or more CloudMonitor services at once | ARMS automatically rewrites the callback URL for every alert rule under the selected services |
| Rule-level integration | Selectively routing specific alert rules | You manually paste the ARMS webhook URL into individual CloudMonitor alert rules |
Prerequisites
Before you begin, ensure that you have an Alibaba Cloud account with access to both the ARMS console and the CloudMonitor console.
Create a service-level integration
In the ARMS console, choose Alert Management > Integrations in the left-side navigation pane.
On the Alert Integration tab, click CloudMonitor.
In the dialog box, configure the following settings:
Name and Description for the integration.
Auto-recovery time -- If an alert event is not triggered again within this period, ARMS automatically clears the event.
In the Services with Alert Events Enabled section, the All Services list shows every CloudMonitor service available under your account. Select the services whose alerts you want to integrate, click the
 icon to move them to the selected list, and then click Save.Note This step causes ARMS to scan all alert rules for the selected services and rewrite their callback URLs to
https://alerts.aliyuncs.com/api/v1/cm/callback/{{token}}, where{{token}}is a key generated automatically for this integration.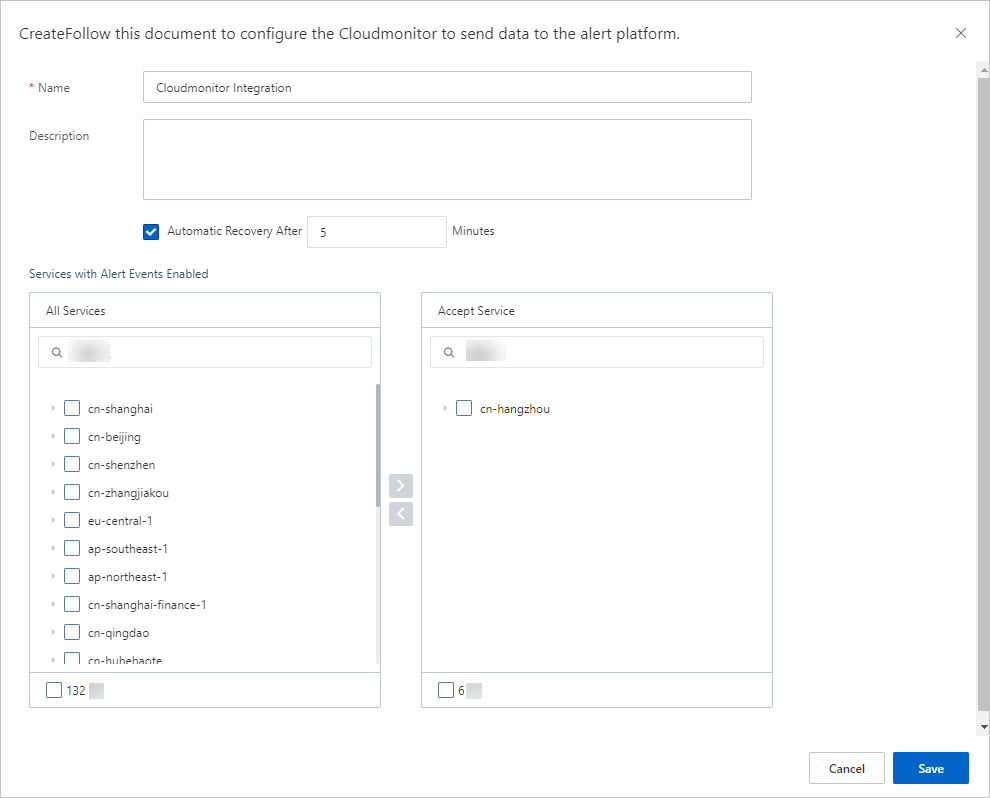
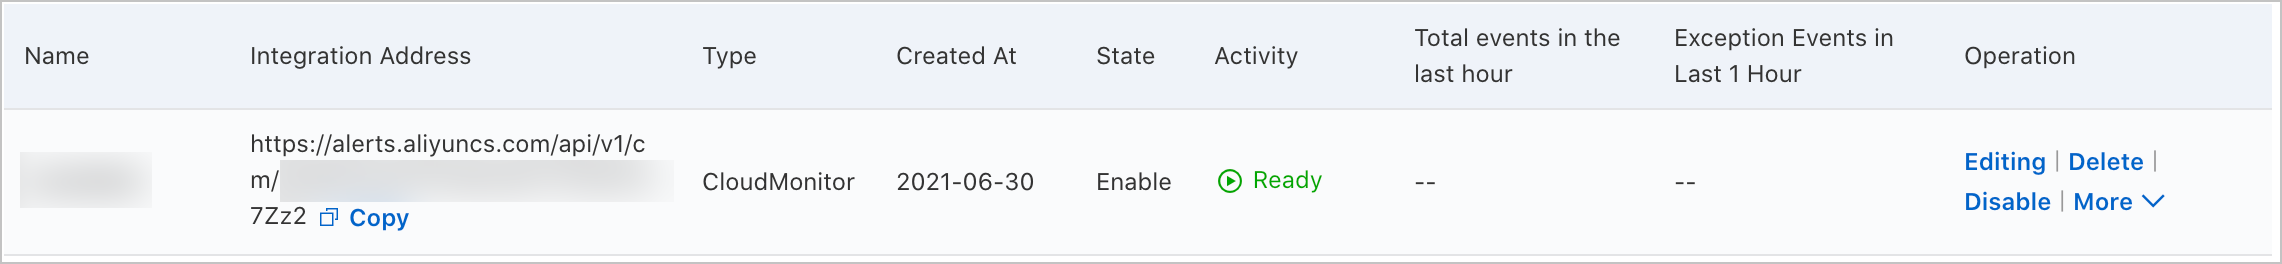
After you save, the new integration appears on the Alert Integration tab.
Integrate specific alert rules
You can only add specific alert rules to an existing CloudMonitor integration. Create an integration first if you have not done so.
On the Alert Integration tab of the Integrations page, find the target CloudMonitor integration and copy its URL.
Log on to the CloudMonitor console.
In the left-side navigation pane, choose Alerts > Alert Rules.
Find the alert rule to modify and click Modify in the Actions column.
In the Create Alert Rule panel, go to Advanced Settings and paste the integration URL into the Alert Callback field.
Click OK.
The selected alert rule now sends events to the ARMS integration.
Configure field mappings
Alert Management provides field mappings between Grafana alert sources and ARMS alert events. You can also add or modify the mappings between fields on the Edit Integration page. To customize mappings, edit the integration.
Send test data
On the Alert Integration tab, find the integration and click Edit in the Actions column.
In the Event Mapping section, click Send Test Data.
Paste alert content in JSON format and click Send.
If the message Uploaded. No events are generated. Configure mappings based on the original data. appears, the fields are not yet mapped. The raw payload is displayed in the left panel for reference when configuring mappings.
If the message Uploaded. appears, the data was successfully mapped and is available on the Alert Event History page. See View historical alert events.
Click Disable to close the test data dialog.
Set up field mappings
In the Event Mapping section:
In the left panel, click a data record to view its fields.
In the right panel, map source fields to ARMS alert fields. Click the mapping icon next to each field to choose a mapping method:
Method Description Direct Maps a source field directly to an ARMS field Series Concatenates multiple source fields using a delimiter, then maps the result to an ARMS field. Only special characters are supported as delimiters. Conditional Maps source fields to ARMS fields only when specified conditions are met Mapping table Maps source severity values to ARMS severity levels
ARMS alert fields reference
| Field | Description |
|---|---|
alertname | Custom alert name |
severity | Severity level. Must use the Direct mapping method. |
message | Alert description used as notification content. Maximum 15,000 characters. |
value | Sample metric value |
imageUrl | URL of a Grafana metrics line chart |
check | Check item (for example, CPU, JVM, Application Crash, Deployment) |
source | Alert source |
class | Object type that triggers the event (for example, host) |
service | Source service (for example, Login Service) |
startat | Event start timestamp |
endat | Event end timestamp |
generatorUrl | URL linking to event details |
Enable batch processing (optional)
If the alert data contains an array node, designate it as the root node for batch processing. Each element in the array is then processed as a separate event.
In the Select Root Node section, select Use Batch Processing, then choose the array node.
Configure event deduplication
Deduplication merges multiple events that share the same value for a designated field into a single alert notification. This reduces noise from repeated alerts.
In the Event Deduplication section on the Integration Details page, select the fields to use for deduplication.
Click Deduplication Test to preview how historical events would be grouped.
Note The test runs against the most recent 10 data records uploaded in the Event Mapping section. Deduplication applies only to uncleared events.Click Save.
View alert event details
In the ARMS console, choose Alert Management > Alert Event History in the left-side navigation pane.
Click an alert event name to view its details. See View historical alert events.
Add services to an existing integration
On the Integrations page, find the CloudMonitor integration and choose More > Select a product in the Actions column.
Select the additional services, click the
icon, and then click Save.
Manage integrations
On the Alert Integration tab, the following operations are available:
| Action | Steps |
|---|---|
| View details | Click the integration row to open the Integration Details page. |
| Update key | Choose More > Update Key, then click OK. After the key is updated, re-add the monitored services to the integration. See Add services to an existing integration. |
| Edit | Click Edit in the Actions column, modify settings on the Integration Details page, and click Save. |
| Enable or disable | Click Disable or Enable in the Actions column. |
| Delete | Click Delete in the Actions column, then click OK. |
| Add an event processing flow | Click Add Event Processing Flow in the Actions column. See Work with event processing flows. |
| Create a notification policy | Choose More > Create Notification Policy. See Create and manage a notification policy. |
What to do next
Set up a notification policy to define how ARMS generates and routes alert notifications. See Create and manage a notification policy.
To review sent alerts, go to the Alert Sending History page. See View historical alerts.