Production JavaScript errors are hard to debug: the code is minified, and each user's device, browser, and network conditions are unique. Most browser monitoring approaches rely on the PerformanceTiming object, which captures only the full page loading time and excludes static resource loading times, making it difficult to identify performance bottlenecks. Browser Monitoring in Application Real-Time Monitoring Service (ARMS) combines source map support with user behavior backtracking so you can map minified stack traces back to source code and replay the exact user actions that triggered an error.
Prerequisites
Before you begin, make sure that you have:
The ARMS Browser Monitoring agent installed in your application. For setup instructions, see Browser Monitoring overview
A source map file generated by your build tool (see Generate source maps)
How source maps work
A source map is a JSON file that maps positions in minified code back to the corresponding positions in your original source. It uses VLQ encoding to store location data compactly. With a source map, Browser Monitoring translates an error at "Line 1, Column 79585" into a precise file, line, and column in your source code.
Diagnosis workflow
The following workflow walks through the end-to-end process: identify error trends, map minified stack traces to source code, then replay the user actions that triggered the error.
Step 1: View the error overview
Log on to the ARMS console.
In the left-side navigation pane, choose .
On the Browser Monitoring page, select a region in the top navigation bar and click the name of the application that you want to manage.
In the left-side navigation pane, click JS Error Diagnosis.
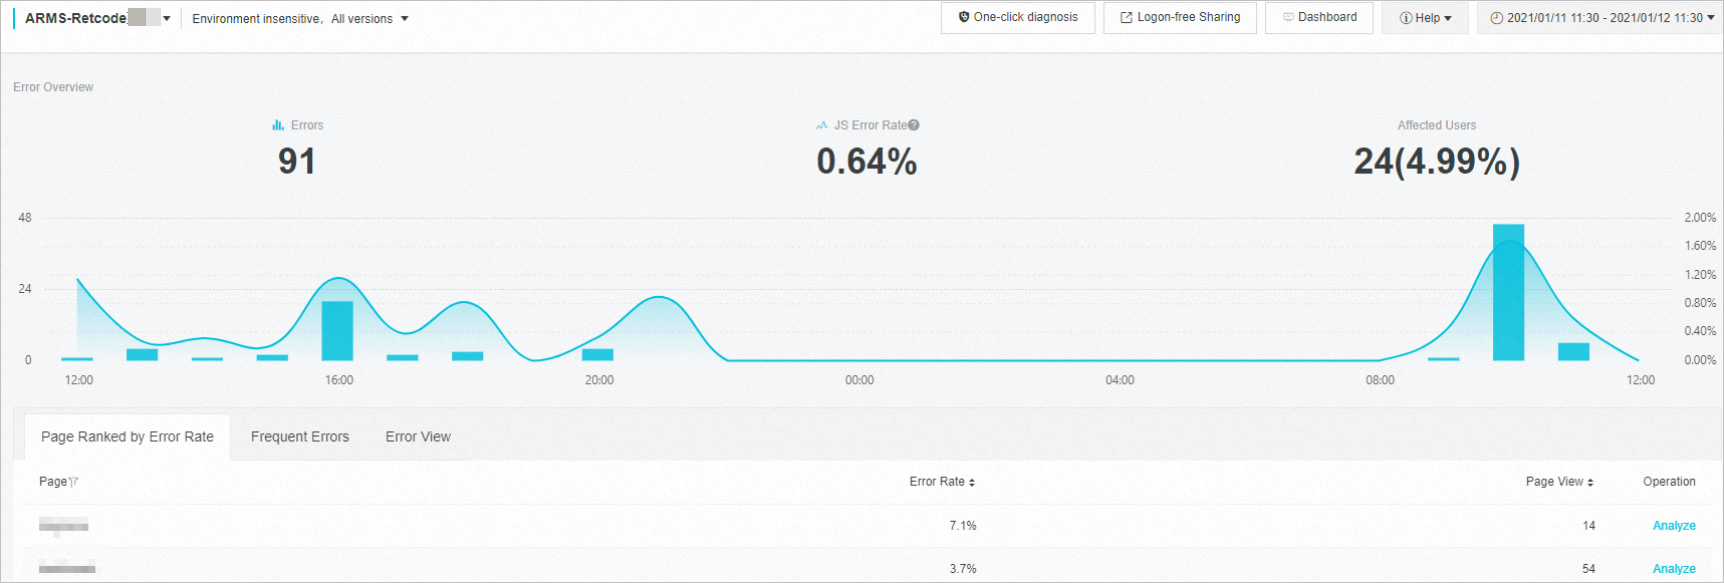
On this page:
The Error Overview section shows the total number of errors, JS error rate, and the number and percentage of affected users.
The curve chart shows error trends over time.
The Frequent Errors tab lists high-frequency errors.
The Page Ranked by Error Rate and Error View tabs show error distribution across pages.
Step 2: Drill into a specific error
Two entry points are available:
On the Frequent Errors tab, click Diagnose next to the target error.
In the curve chart, click a data point at a specific time to open the Exception Insight dialog box.
The following example uses the curve chart approach:
On the curve chart, identify a point where the error rate spikes. Hover over the inflection point until the pointer changes to a hand icon, then click it. The Exception Insight dialog box appears. For more information, see View exception insight.
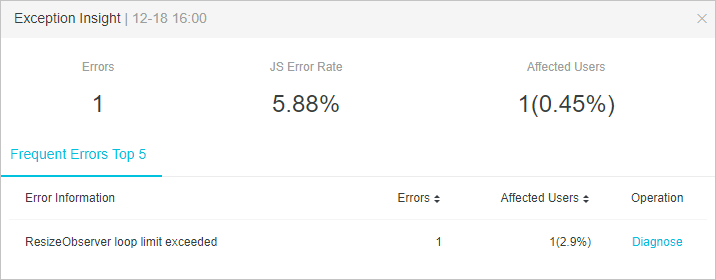
Click the Frequent Errors Top 5 tab, select an error, and click Diagnose in the Operation column. The Error Detail tab appears.
Step 3: Review error details
The error detail page provides the following context:
| Field | Description |
|---|---|
| First occurrence time | When the error was first recorded |
| Version for first occurrence | The application version when the error first appeared (optional) |
| Error name and type | The JavaScript error name and classification |
| Occurrence time | When this error instance occurred |
| Device, OS, browser | The client environment where the error occurred |
| IP address, region | The network location of the user |
| Connection type | The network connection (Wi-Fi, 4G, and so on) |
| Error URL | The page URL where the error was triggered |
| Application version | The deployed application version |
| File, line, column | The position in the minified file |
Example: The following screenshot shows an error from a map module on a real-time dashboard. The module reported invalid data during an update, and the stack trace points to Line 1, Column 79585 in the minified bundle.
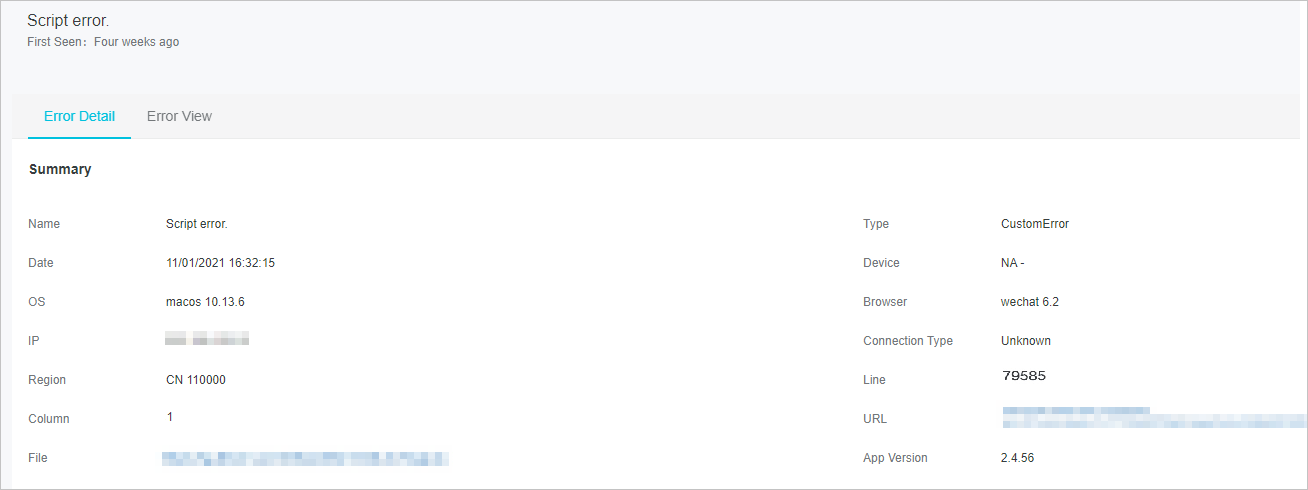
"Line 1, Column 79585" is not actionable because the production code is minified. The next step maps this position back to your source code.
Step 4: Map the error to source code
The line and column numbers in the stack trace point to minified code, not your source files. Apply a source map to resolve the original error location.
In the Stack Info section, click the
 icon on the left of a stack frame to expand it, then click Choose Sourcemap.
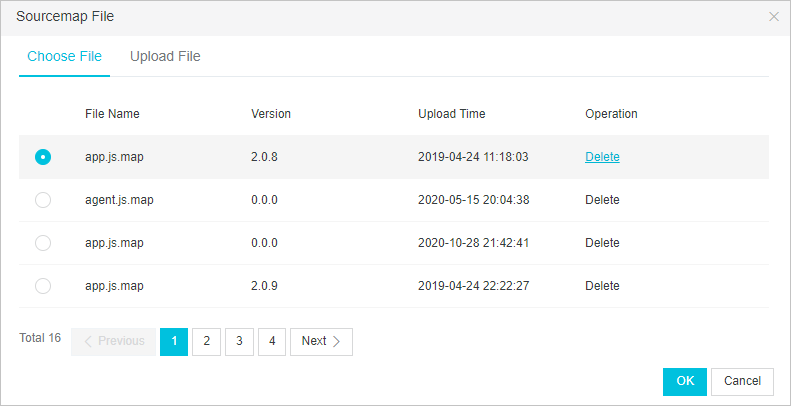
In the Sourcemap File dialog box, select an existing source map file or upload a new one, then click OK.
NoteYou can upload up to five files at a time.
After applying the source map, Browser Monitoring highlights the original error location in red in the Source Code section, showing the exact file and line where the error occurred. Apply source maps to each frame in the error stack to trace the full call chain.
Step 5: Reproduce the error with user behavior backtracking
Source map mapping reveals *where* the error occurred, but not always *why*. In the map module example, source code mapping shows that invalid data caused the error during component creation. However, the source code already includes null checks and fault tolerance for this data. To understand why the invalid data appeared, review what happened immediately before the error.
Browser Monitoring records user behavior as a chronological trace of event nodes:
Page loading
Route changes
Page clicks
API requests
Console output
Review this trace to replay the sequence of actions that led to the error.
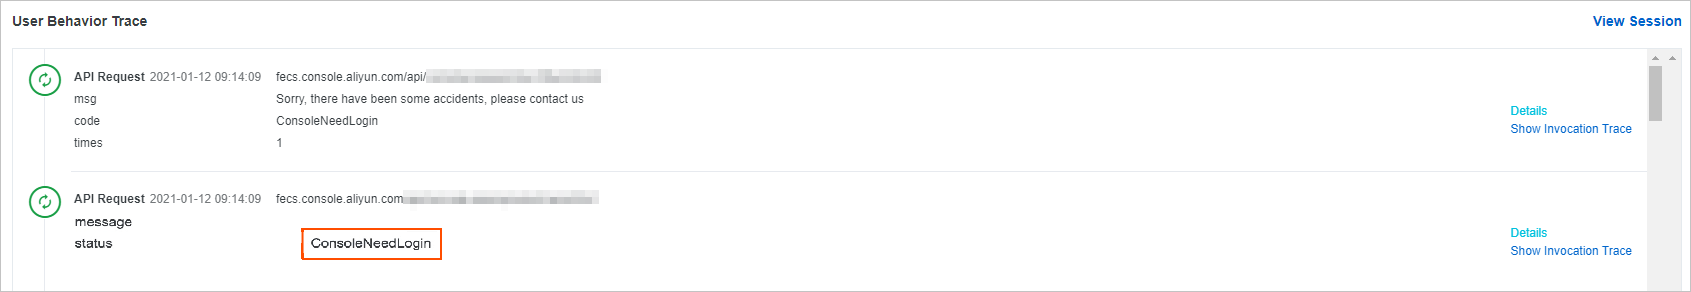
Example: The following user behavior trace shows that an API request occurred just before the error. The API call requested a real-time update for the map module, but the response returned ConsoleNeedLogin instead of valid map data. This indicates that the user had logged off from the page -- the root cause of the invalid data.
Generate source maps
Source maps are required for Step 4 of the diagnosis workflow. Generate a source map with your build tool, then upload it to the ARMS console.
To upload a source map file, find your application on the Browser Monitoring page, and choose More > Settings in the Actions column. On the settings page, click the Advance tab.
Webpack
In webpack.config.js, set the devtool property to "source-map". Webpack supports 13 devtool values for different types of source maps. "source-map" generates a full, separate .map file, which is recommended for production error diagnosis.
const path = require('path');

module.exports = {
    entry: './src/index.js',
    output: {
        filename: 'bundle.js',
        path: path.resolve(__dirname, 'dist')
    },
    devtool: "source-map"
};
Gulp
Use the gulp-sourcemaps package:
var gulp = require('gulp');
var sourcemaps = require('gulp-sourcemaps');

gulp.task('javascript', function() {
    gulp.src('src/**/*.js')
        .pipe(sourcemaps.init())
        .pipe(sourcemaps.write('../sourcemaps'))
        .pipe(gulp.dest('dist'));
});
Grunt
With grunt-contrib-uglify only:
grunt.initConfig({
    uglify: {
        options: {
            sourceMap: true
        }
    }
});
With grunt-usemin (which calls grunt-contrib-concat and grunt-contrib-uglify):
grunt.initConfig({
    concat: {
        options: {
            sourceMap: true
        }
    },
    uglify: {
        options: {
            sourceMap: true,
            sourceMapIn: function(uglifySource) {
                return uglifySource + '.map';
            },
        }
    }
});
With grunt-jsmin-sourcemap:
module.exports = function(grunt) {
    grunt.loadNpmTasks('grunt-jsmin-sourcemap');
    grunt.initConfig({
        'jsmin-sourcemap': {
            all: {
                src: ['scripts/script.js'],
                dest: 'scripts/script.jsmin-grunt.js',
                destMap: 'scripts/script.jsmin-grunt.js.map'
            }
        }
    });
    grunt.registerTask('default', 'jsmin-sourcemap');
};
Angular CLI
ng build --prod --source-map --vendor-source-mapUglifyJS2
UglifyJS2 is a CLI tool. For more options, see CLI source map options.
uglifyjs app.js -o app.min.js --source-map app.min.js.mapSystemJS
Use SystemJS Builder:
builder.bundle('app.js', 'app-outfile.js', {
    minify: true,
    sourceMaps: true
});