In the process of JavaScript (JS) error diagnostics, Application Real-Time Monitoring Service (ARMS) browser monitoring provides the user behavior backtracking feature to show you a comprehensive list of the user behaviors that lead up to the errors.
Background information
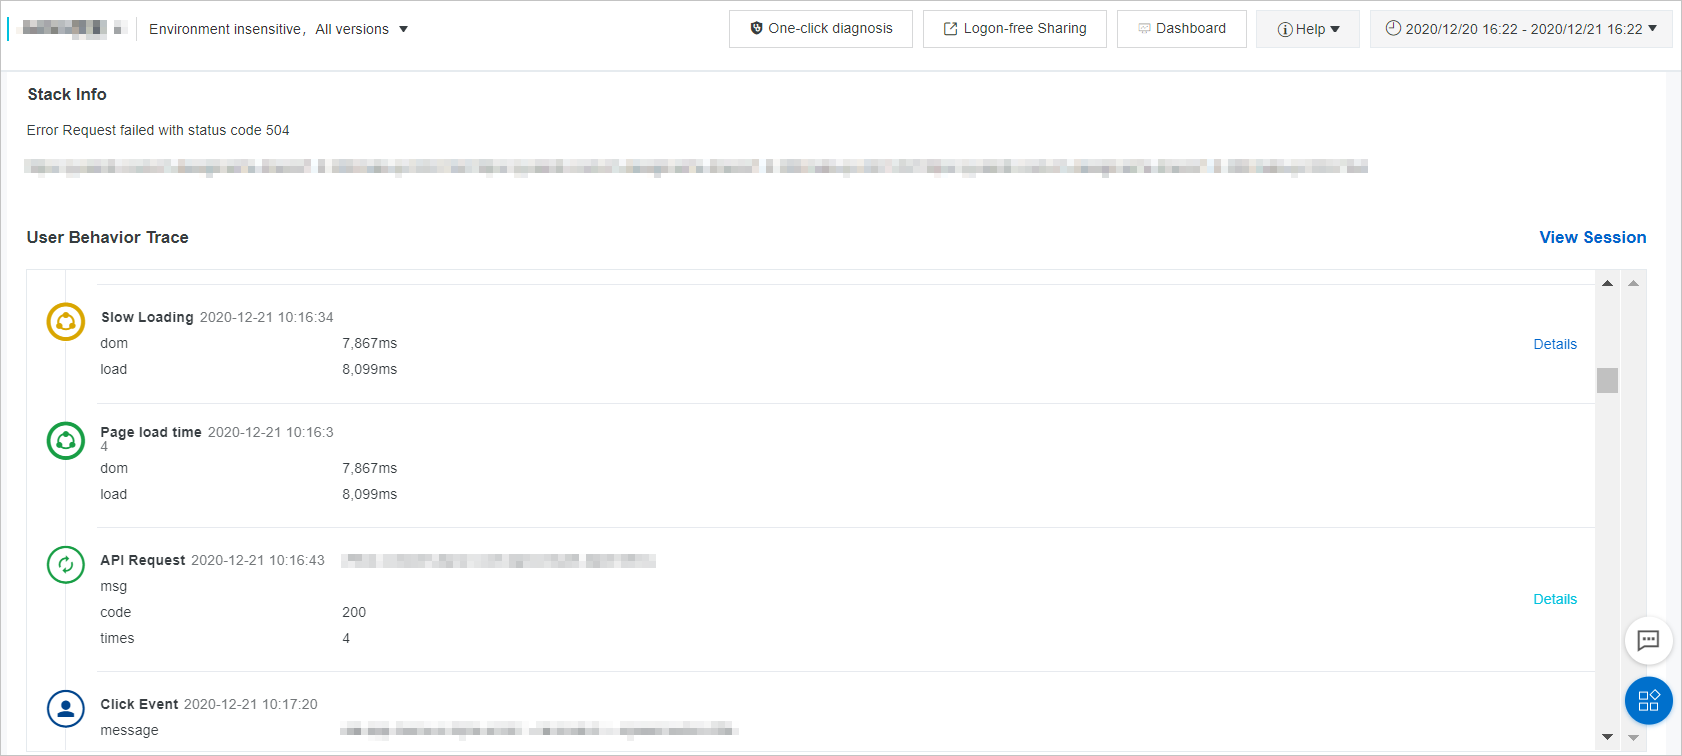
ARMS browser monitoring defines all events on the page as user behaviors, including console behaviors, page jumps, user clicks, user inputs, and API calls. You can connect user behaviors in chronological order to form a behavior trace. Then, you can backtrack and analyze the behavior trace to reproduce the situation in which a specific error occurred.
Step 1: Install an ARMS agent
After you install the ARMS agent, your frontend applications can be fully monitored. Select a method to install the ARMS agent as needed. For more information, see Browser monitoring overview.
Step 2: Diagnose an error
Use the user behavior backtracking feature to reproduce the situation in which a specific JS error occurred and diagnose causes of the error.
Log on to the ARMS console. In the left-side navigation pane, choose .
On the Browser Monitoring page, select a region in the top navigation bar and click the name of the application that you want to manage.
- In the left-side navigation pane, choose Application > JS Error Diagnosis.
- On the JS Error Diagnosis page, click the Frequent Errors tab.
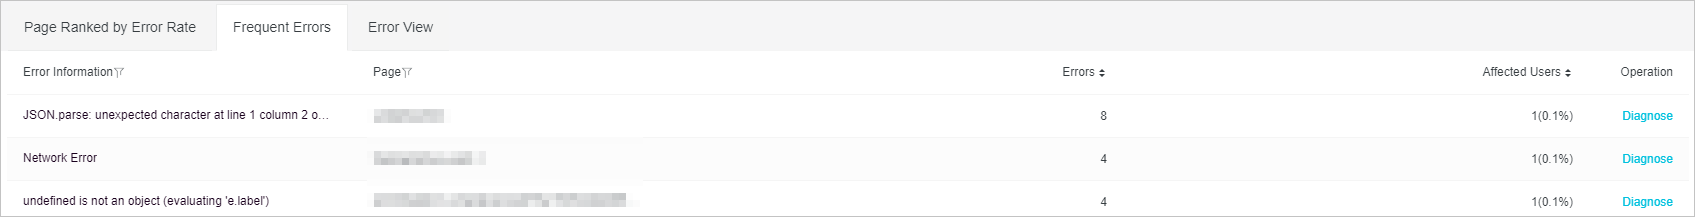
- Click Diagnose in the Actions column of the error that you want to diagnose.
- On the Error Detail page, analyze user behaviors in the User Behavior Trace section to determine the behaviors that cause the error.