As your monitored environments grow, Managed Service for Prometheus collects an increasing volume of metrics -- many of which may no longer serve active dashboards, alerts, or queries. These unused metrics consume storage and increase monitoring costs. Discard unnecessary metrics to stop their collection and storage, and reduce your Prometheus billing. You can restore any discarded metric at any time to resume collection.
Identify metrics to discard
Before discarding metrics, review your metric volume to find high-cost, low-value candidates. Focus on metrics that meet one or more of these criteria:
High volume, no consumers: Metrics with a large Proportion value that are not used in any dashboard, alert rule, or recording rule.
Redundant metrics: Multiple metrics that track the same dimension at different granularities, where only one granularity is needed.
Deprecated workloads: Metrics from services, jobs, or namespaces that are no longer active.
To view your current metrics:
Log on to the ARMS console. In the left-side navigation pane, choose Managed Service for Prometheus > Instances.
Click the name of the Managed Service for Prometheus instance.
In the left-side navigation pane, click Service Discovery. On the Metrics tab, review the collected metrics.
NoteUse the dropdown filters to filter by job name or metric type. Enter a keyword in the search box for fuzzy matching. Sort by Proportion or Metric Quantity in Last 10 Minutes in descending order to surface the highest-volume metrics first.
Parameter Description Metric Name The metric identifier Job Name The scrape job that collects this metric Metric Type Basic Metrics or Custom Metrics Proportion The percentage of total reported data that this metric represents Metric Quantity in Last 10 Minutes The number of data points reported and stored in the last 10 minutes
Discard metrics
After you identify metrics that are no longer needed, discard them to stop collection and storage. Discarded metrics are not charged.
Log on to the ARMS console. In the left-side navigation pane, click Integration Management.
On the Integrated Environments tab, click the name of the environment that you want to manage.
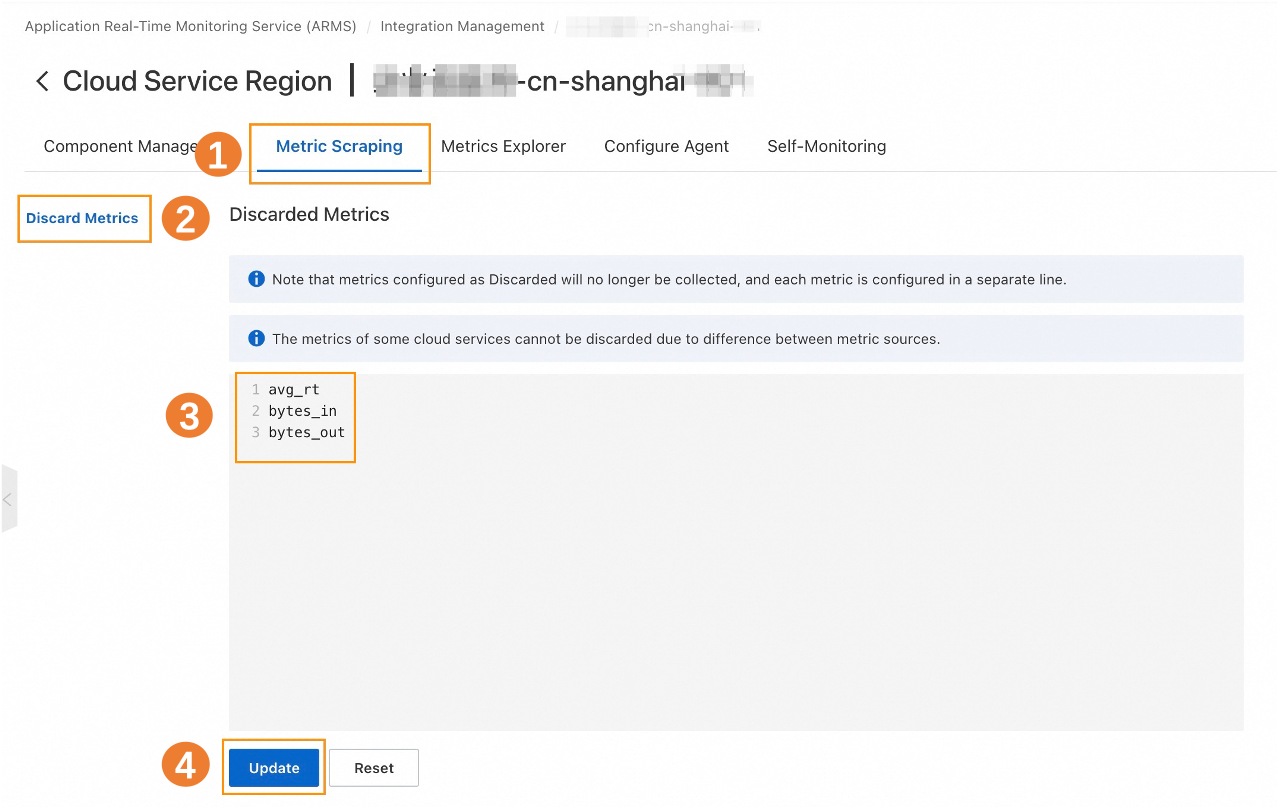
Click the Metric Scraping tab, and then click Discard Metrics.
In the text box, enter the names of the metrics to discard, one metric name per line. Then click Update.
NoteSeparate metric names with line breaks only. Commas, semicolons, colons, and spaces are not supported as separators.
Restore discarded metrics
To resume collecting a previously discarded metric, remove it from the discard list.
After you restore discarded metrics, the metrics are no longer in the discarded state. They can be reused, and will incur fees.
Log on to the ARMS console. In the left-side navigation pane, click Integration Management.
On the Integrated Environments tab, click the name of the environment that you want to manage.
Click the Metric Scraping tab, and then click Discard Metrics.
In the text box, delete the metric names you want to restore. Then click Update.
Limits
The following metrics cannot be discarded:
Basic metrics for Container Service for Kubernetes (ACK) clusters
Metrics reported through Pushgateway, RemoteWrite, or the OpenTelemetry protocol
Metrics reported after the metric convergence feature is enabled, such as metrics from Alibaba Cloud Service Mesh (ASM) Premium Edition
Advanced metrics ingested from cloud services (second-level metrics that do not start with
Aliyun)Metrics of a general-purpose Managed Service for Prometheus instance. To view these metrics, go to the instance details page and click Metric Management in the left-side navigation pane.
Prerequisites
Before you begin, ensure that you have:
A Managed Service for Prometheus instance. For setup instructions, see: