Alibaba Cloud Managed Service for Prometheus allows you to integrate the monitoring data of multiple Alibaba Cloud services and provides default Grafana dashboards and alert rules. This topic uses ApsaraDB RDS for MySQL as an example to show how to integrate an Alibaba Cloud service into Managed Service for Prometheus.
Prerequisites
Managed Service for Prometheus is activated. For more information, see Instance billing.
Hybrid Cloud Monitoring is activated. For more information, see Activate Hybrid Cloud Monitoring.
Step 1: Integrate the monitoring data of the cloud service into Managed Service for Prometheus
Log on to the ARMS console.
In the left-side navigation pane, click Integration Center.
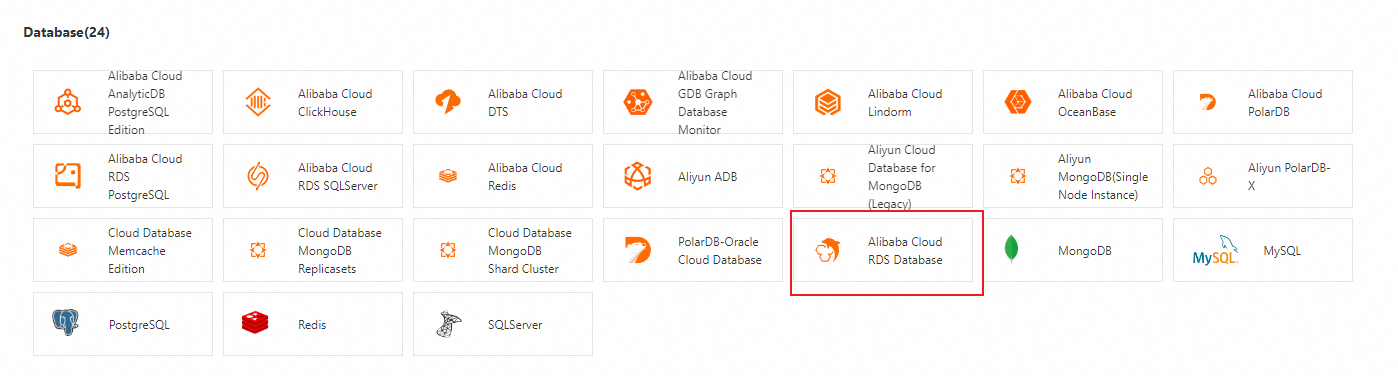
On the Integration Center page, click the Database tab and then click Alibaba Cloud RDS Database.
 Note
NoteManaged Service for Prometheus uses Hybrid Cloud Monitoring to collect cloud service data. If you have not activated Hybrid Cloud Monitoring, click Activate Now. Exporting cloud service data by using Managed Service for Prometheus incurs fees for real-time data export from Hybrid Cloud Monitoring. After Hybrid Cloud Monitoring is activated, click Redetect.
The activation of Hybrid Cloud Monitoring is an asynchronous operation. If the Application Real-Time Monitoring Service (ARMS) console still prompts that Hybrid Cloud Monitoring is not activated, wait for about 10 to 20 seconds and then click Redetect again.
On the Start Integration tab of the page that appears, select the region to store the data and click OK. It takes 1 to 2 minutes to integrate the monitoring data of ApsaraDB RDS for MySQL into Managed Service for Prometheus.
NoteManaged Service for Prometheus integrates the data of ApsaraDB RDS for MySQL within your account in all regions into a single Prometheus instance, including the region where the instance is deployed. We recommend that you deploy the Prometheus instance in a region that you commonly use.
When you integrate the monitoring metrics of a cloud service into Managed Service for Prometheus by using Hybrid Cloud Monitoring, you can synchronize the existing tags that are configured for the monitoring metrics in Hybrid Cloud Monitoring and add the metadata of the Prometheus instance, such as the instance ID or instance tag, as tags of the monitoring metrics related to the instance. The following types of tags are supported for metrics: default tags and custom tags.
Default tags
The default tags vary based on the type of the cloud service. Therefore, when Managed Service for Prometheus collects metrics, it attaches other metadata related to the instance to the corresponding metrics as tags.
Tag name
Description
id
The instance ID.
instanceName
The instance name.
resourceGroupId
The resource group ID.
resourceGroupName
The resource group name.
regionId
The region where the instance resides.
zoneId
The zone ID.
userId
The ID of the Alibaba Cloud account.
namespace
The namespace ID.
product
The cloud service.
measure
The name of the tag configured in Hybrid Cloud Monitoring.
measure_desc
The description of the tag configured in Hybrid Cloud Monitoring.
Custom tags
If the cloud service instance has a tag prefixed with
o11y.aliyun.dev/, the content before o11y.aliyun.dev/ is added as a tag of the monitoring metrics. For example, if the instance tag iso11y.aliyun.dev/project=abc, a new tagproject=abcis added to the monitoring metrics.
Step 2: View the dashboards
Log on to the ARMS console.
In the left-side navigation pane, click Integration Management.
On the Integrated Environments tab of the Integration Management page, click Cloud Service Region.
On the Cloud Service Region tab, click the name of the environment instance that you want to manage.
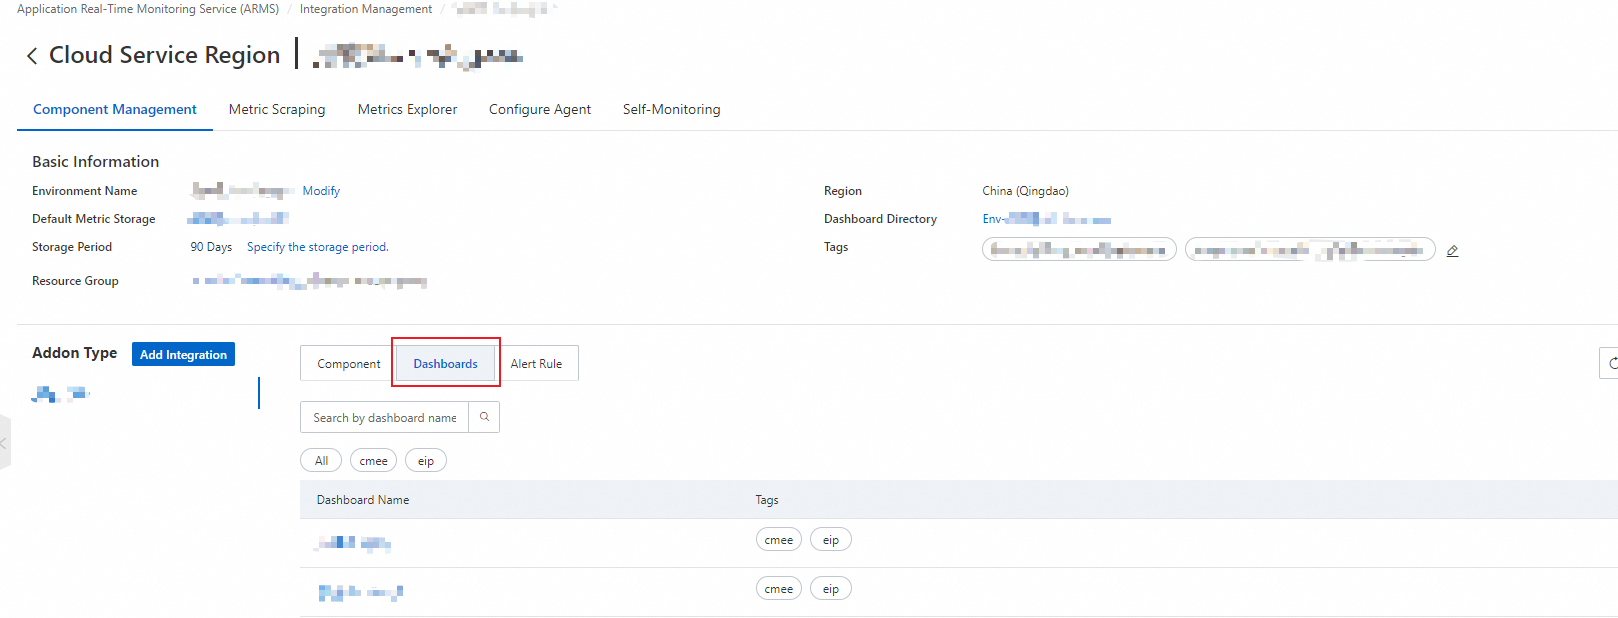
In the Addon Type section of the Component Management tab, click Dashboards to view the built-in Grafana dashboards.
Step 3: Configure alerting
In the left-side navigation pane, click Integration Management.
On the Integrated Environments tab of the Integration Management page, click Cloud Service Region.
On the Cloud Service Region tab, click the name of the environment instance that you want to manage.
In the Addon Type section of the Component Management tab, click Alert Rule to view the built-in alert rules.
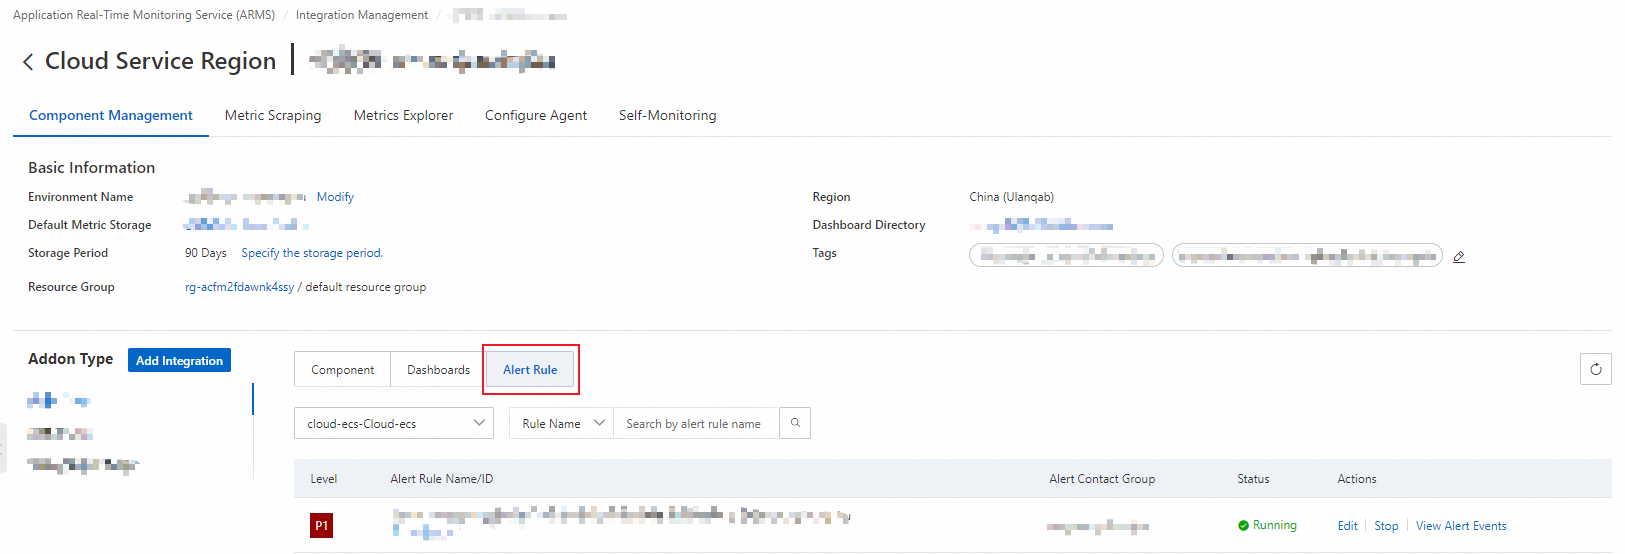
The built-in alert rules generate alert events without sending alert notifications. If you want to send alert notifications by using emails or other channels, click Edit to configure the notification methods. On the Edit Prometheus Alert Rule page, you can customize the alert threshold, duration, and alert message. For more information, see Create an alert rule for a Prometheus instance.
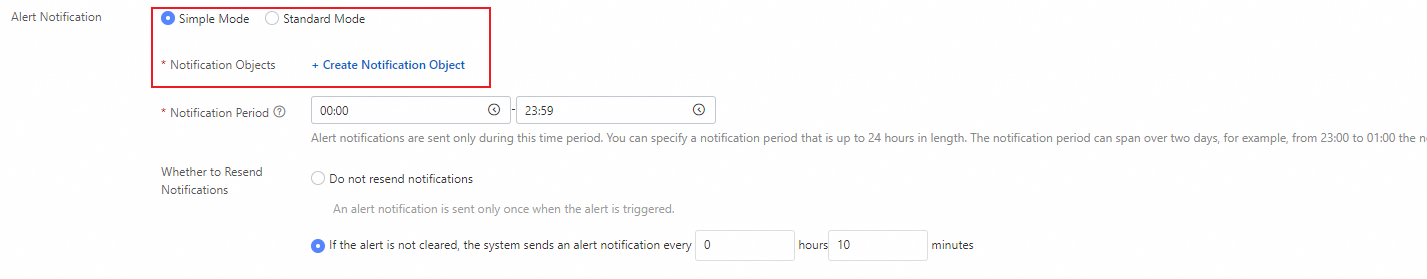
If you set Alert Notification to Simple Mode, you can configure the contacts that receive alert notifications and the notification period, and specify whether alert notifications are repeatedly sent.
Step 4: Create custom global dashboards for the cloud service
After you create a Grafana workspace, you can create custom Grafana dashboards based on your business requirements in the workspace. To create a custom dashboard, perform the following steps:
Create a custom workspace
Log on to the ARMS console.
In the left-side navigation pane, click Integration Management.
On the Integrated Environments tab of the Integration Management page, click Cloud Service Region.
On the Cloud Service Region tab, click the name of the environment instance that you want to manage.
In the Basic Information section of the Component Management tab, click the instance name to the right of Default Metric Storage.
In the Basic Information section of the Settings tab, click Create Workspace.
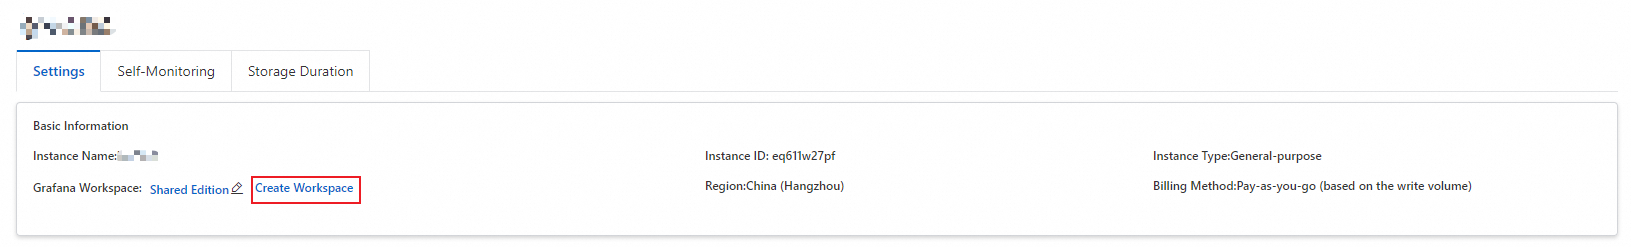
On the Create Workspace page, configure the parameters as prompted and click Create Now.
Modify the Grafana workspace
After the Grafana workspace is created, go back to the Settings tab of the Prometheus instance and click the  icon. In the dialog box that appears, select the workspace that you created, click OK, and then click OK.
Log on to Grafana
Log on to the ARMS console.
In the left-side navigation pane, choose .
Click the name of the Grafana workspace displayed in the Grafana Workspace column of the Prometheus instance to log on to Grafana.
Create a dashboard for cloud resource monitoring
This section describes how to create a dashboard for the monitoring data of Elastic Compute Service (ECS) and ApsaraDB RDS instances. The steps to create a dashboard to monitor data of other cloud services are similar.
In this example, Grafana V10.0.x is used.
Create an ECS monitoring dashboard
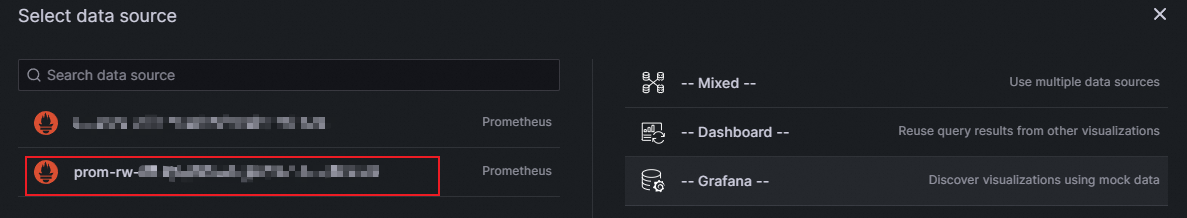
On the Dashboards tab, click + Create Dashboard. On the page that appears, click + Add visualization. On the Select data source dialog box, select the default data source.
Select Table from the drop-down list in the upper-right corner of the page.
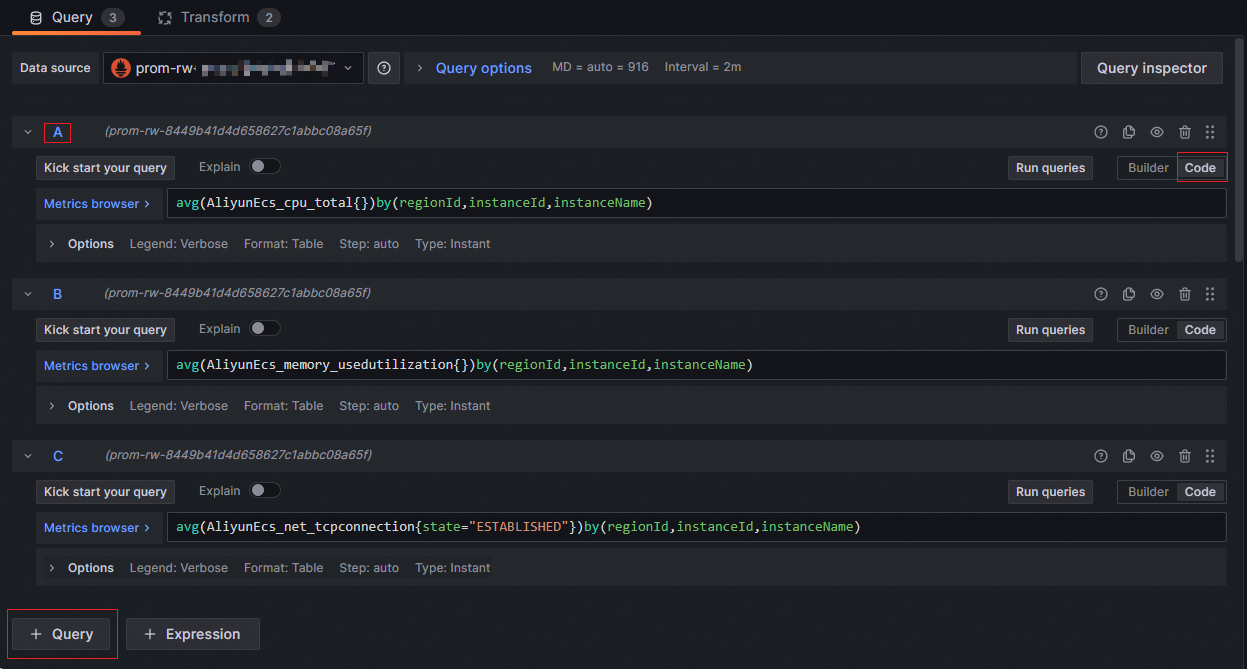
In the lower-left corner of the page, click + Query twice to add the B and C sections. Click Code on the right side of the A, B, and C sections respectively.
Enter the following code in the corresponding Metrics browser code blocks in the A, B, and C sections.
Section
Code
A
avg(AliyunEcs_cpu_total{})by(regionId,instanceId,instanceName)B
avg(AliyunEcs_memory_usedutilization{})by(regionId,instanceId,instanceName)C
avg(AliyunEcs_net_tcpconnection{state="ESTABLISHED"})by(regionId,instanceId,instanceName)Click Options in the A, B, and C sections respectively, select Table for Format, and then select Instant for Type.
In the lower-right corner of the page, click Transform.
Click + Add transformation. In the search box that appears, enter Merge and click Merge to add it to the Transform section.
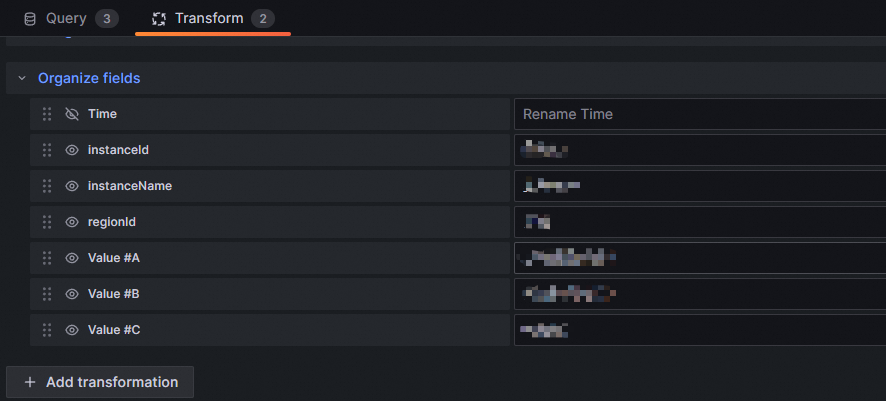
Click + Add transformation. In the search box that appears, enter Organize fields and click Organize fields to add it to the Transform section.
Click the
 icon in front of Time and configure the tags described in the following table:
 Tag
Value
instanceId
Instance ID
instanceName
Instance Name
regionId
Region
Value #A
CPU Usage (%)
Value #B
Memory Usage (%)
Value #C
Connections
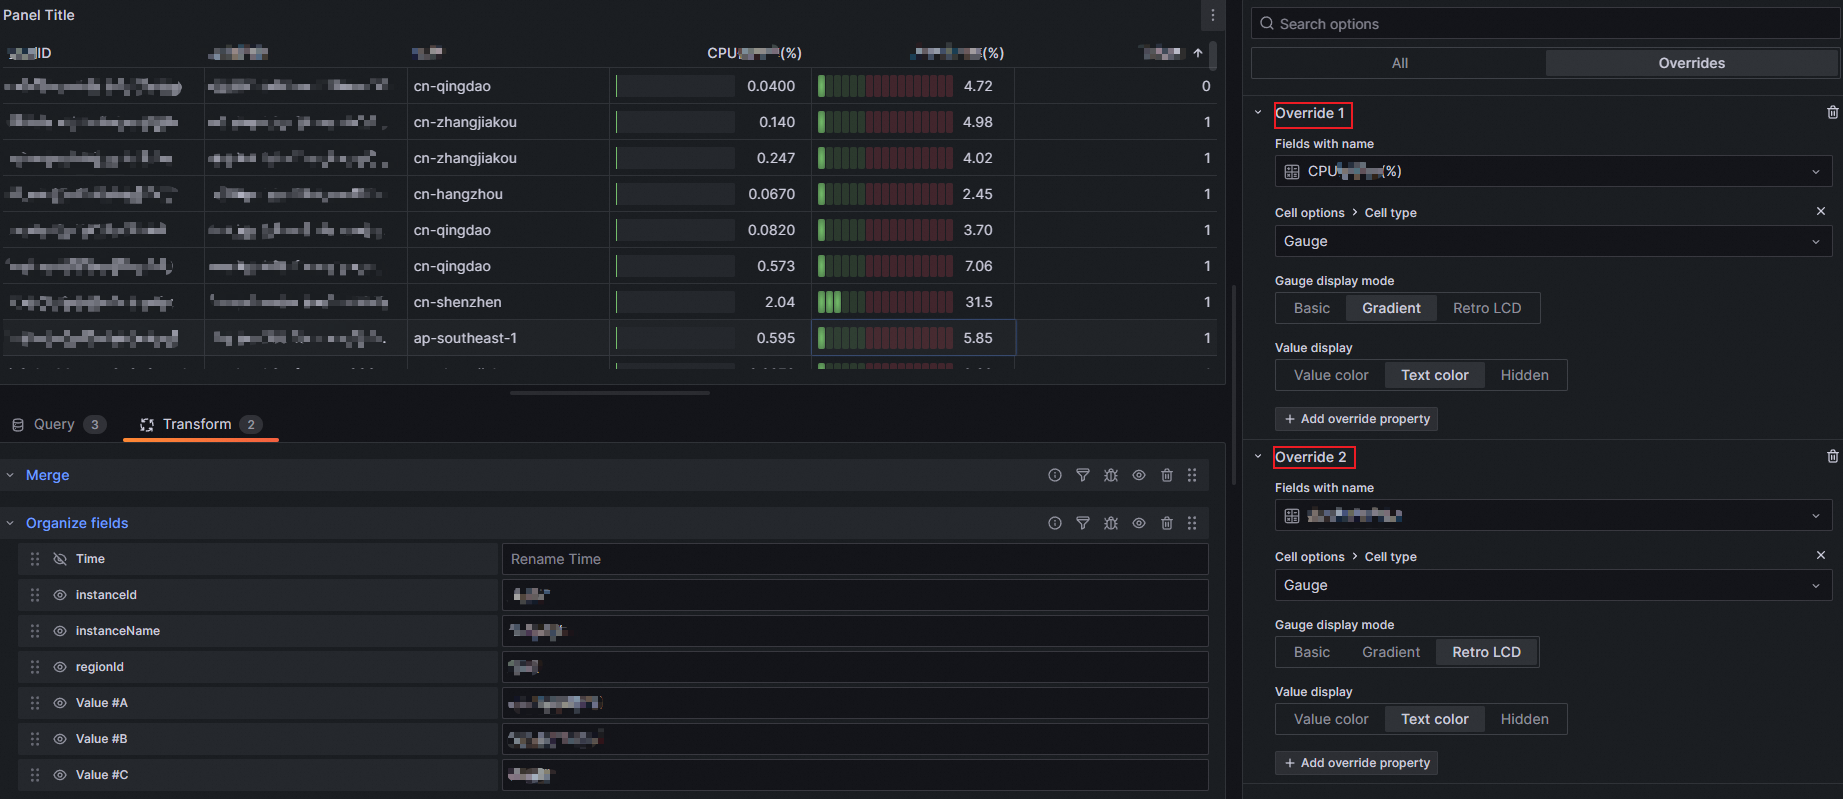
On the right side of the page, click Overrides and configure the parameters.
Click + Add field override, select Fields with name, and then select CPU Usage (%) from the drop-down list to create Override 1. Repeat the first two steps and then select Memory Usage (%) from the drop-down list to create Override 2.
Click + Add override property in the Override 1 and Override 2 sections, select Cell options > Cell type from the drop-down list, and then select Gauge > Gauge display mode or Gauge > Value display from the drop-down list based on your business requirements. The following table describes the tags:
Tag
Value
Gauge display mode
Retor LCD
Value display
Text color
In the upper-right corner of the page, click Save to save the dashboard.
Create an ApsaraDB RDS monitoring dashboard
After the ECS monitoring dashboard is created, click the
 icon in the upper-right corner of the page and select Visualization from the drop-down list.
 On the left side of the page, select the default data source from the Date source drop-down list.

In the search box in the upper-right corner of the page, search for and select Table.
In the lower-left corner of the page, click + Query twice to add the B and C sections. Click Code on the right side of the A, B, and C sections respectively.
Enter the following code in the corresponding Metrics browser code blocks in the A, B, and C sections.
Section
Code
A
avg(AliyunRds_CpuUsage{engine="MySQL"})by(regionId,instanceId,instanceName)B
avg(AliyunRds_MemoryUsage{engine="MySQL"})by(regionId,instanceId,instanceName)C
avg(AliyunRds_DiskUsage{engine="MySQL"})by(regionId,instanceId,instanceName)Click Options in the A, B, and C sections respectively, select Table for Format, and then select Instant for Type.
In the lower-right corner of the page, click Transform.
Click + Add transformation. In the search box that appears, enter Merge and click Merge to add it to the Transform section.
Click + Add transformation. In the search box that appears, enter Organize fields and click Organize fields to add it to the Transform section.
Click the
icon in front of Time and configure the tags described in the following table: Tag
Value
Value #A
CPU Usage (%)
Value #B
Memory Usage (%)
Value #C
Disk Usage (%)
On the right side of the page, click All. In the Panel options section of the All tab, set Title to ApsaraDB RDS Instance.
On the right side of the page, click Overrides and configure the parameters.
Click + Add field override, select Fields with name, and then select CPU Usage (%) from the drop-down list to create Override 1. Repeat the first two steps and then select Memory Usage (%) from the drop-down list to create Override 2. Repeat the first two steps and then select Disk Usage (%) from the drop-down list to create Override 3.
Click + Add override property in the Override 1, Override 2, and Override 3 sections, select Cell options > Cell type from the drop-down list, and then select Gauge > Gauge display mode or Gauge > Value display from the drop-down list based on your business requirements. The following table describes the tags:
Tag
Value
Gauge display mode
Retor LCD
Value display
Text color
In the upper-right corner of the page, click Save to save the dashboard.