The Application Overview page in the Application Real-Time Monitoring Service (ARMS) console consolidates health metrics, performance trends, event tracking, and dependency topology for an application into a single view. Use this page to assess application health, detect anomalies, and trace bottlenecks across upstream and downstream dependencies.
The page has two tabs:
Overview -- Real-time and historical metrics: request volume, response time, error rates, system resource usage, thread profiling, and application events.
Topology -- A visual map of upstream and downstream components and the call relationships between them.
Open the Application Overview page
Log on to the ARMS console. In the left-side navigation pane, choose Application Monitoring > Applications.
On the Applications page, select a region in the top navigation bar and click the name of the application.
NoteIf the
 icon appears in the Language column, the application is connected to Application Monitoring. If a hyphen (-) appears, the application is connected to Managed Service for OpenTelemetry.
The Application Overview page opens. Select the Overview or Topology tab.
Overview tab
The Overview tab displays real-time and historical performance data in the following sections.
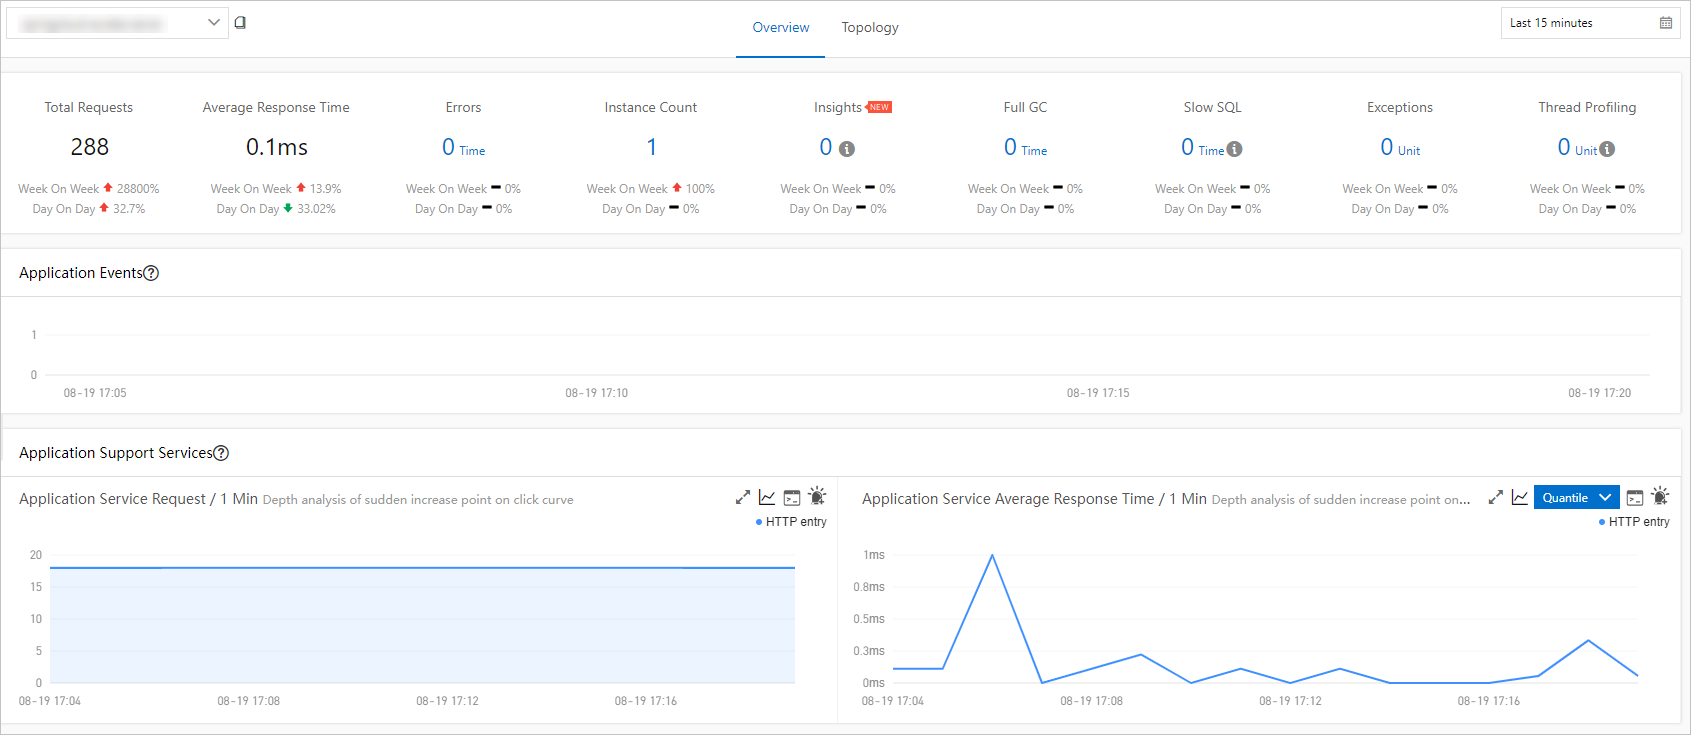
Summary metrics
The top of the page shows summary tiles for the following metrics. Each tile includes a comparison against the previous day and previous week so you can spot trends at a glance.
| Metric | Description |
|---|---|
| Total Requests | Total number of requests received by the application in the selected time range. |
| Average Response Time | Mean response time across all requests. |
| Errors | Total number of error responses. |
| Instance Count | Number of running application instances. |
| Number Questions | Number of diagnostic questions generated. |
| Full GC | Number of full garbage collection events. A spike may indicate memory pressure. |
| Slow SQL | Number of slow SQL queries detected. |
| Exceptions | Number of application exceptions thrown. |
| Thread Profiling | Number of thread profiling samples collected. |
Application events
Displays application events grouped into three categories:
| Event category | Trigger examples |
|---|---|
| Availability alerts | Deadlocks, out-of-memory (OOM) errors, application startup |
| Application monitoring alerts | Alerts configured through ARMS alert rules |
| Kubernetes cluster events | Kubernetes cluster events related to the application. |
Hover over a column in the chart to view the event list at that point in time. For details on configuring and managing events, see Event center.
Application support services
Shows time series curves for the request count and average response time of services provided by the application.
To view the Q-Q plot of average response time, turn on Quantile Statistics in the Advanced Settings section of the Custom Configurations page. For more information, see Customize application settings.
Application dependent services
Shows time series curves for the following metrics of services that the application depends on:
| Metric | Description |
|---|---|
| Request count | Number of outbound requests to each dependent service. |
| Average response time | Mean response time from each dependent service. |
| Instance count | Number of instances within the application making these calls. |
| HTTP status codes | Breakdown of HTTP response status codes returned by dependent services. |
System info
Tracks infrastructure-level metrics over time:
CPU utilization -- Processor usage percentage across application instances.
Memory usage -- Memory consumption across application instances.
Load -- System load average across application instances.
Thread profiling
Displays time series curves and details of slow calls, helping you pinpoint performance bottlenecks at the thread level.
Statistical analysis
Provides analysis of:
Slow interface calls -- Interfaces with slow response times.
Exception types -- Breakdown of exception types and their frequency.
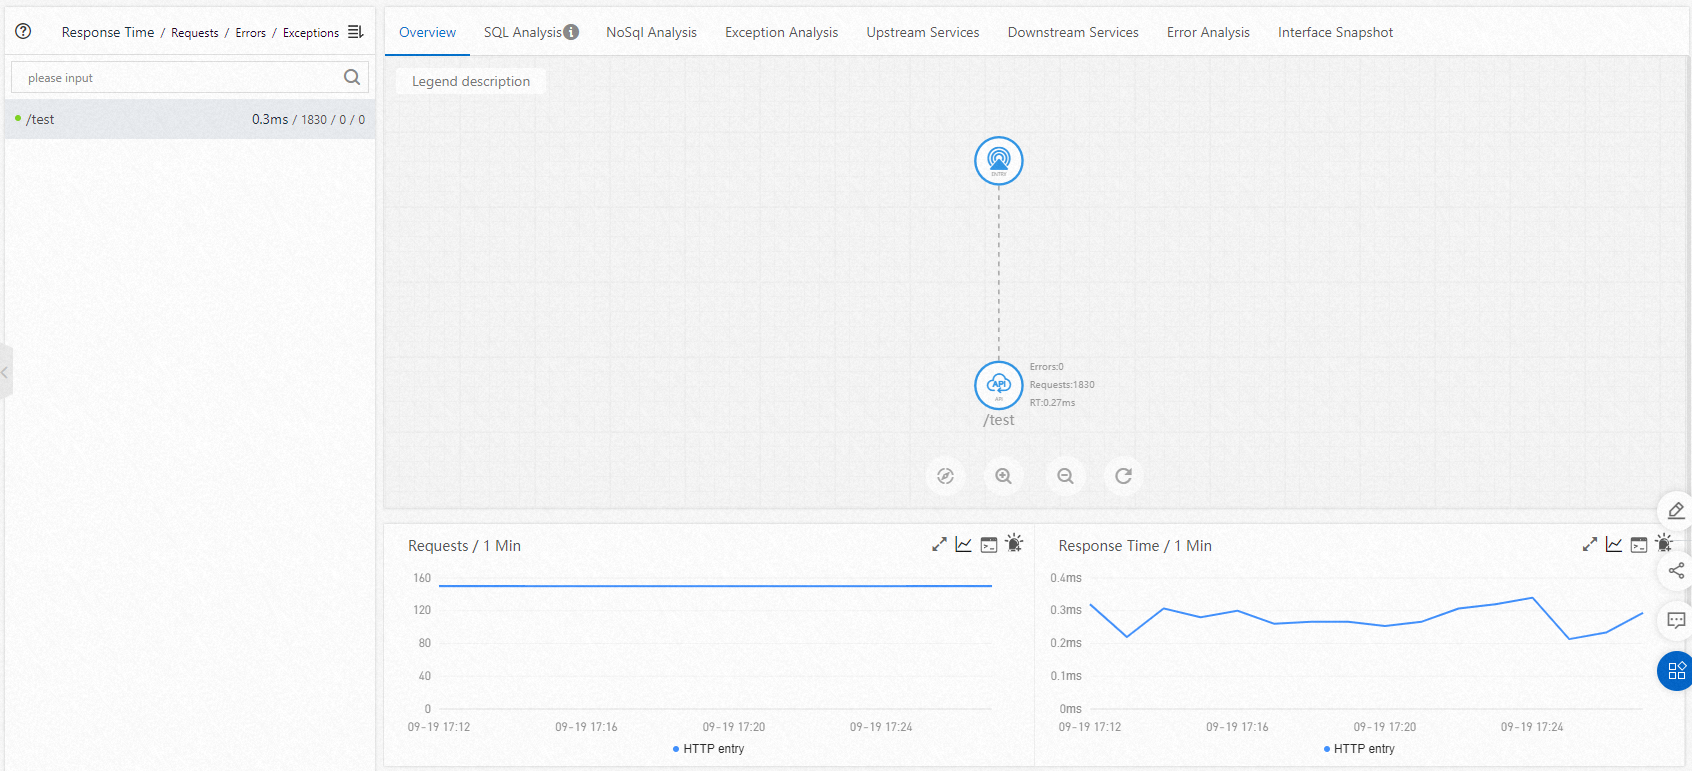
Topology tab
The Topology tab visualizes the upstream and downstream components of the application and the call relationships between them. The topology displays each component as a node, with edges representing call paths and direction. Use the topology to identify the bottlenecks of your application.