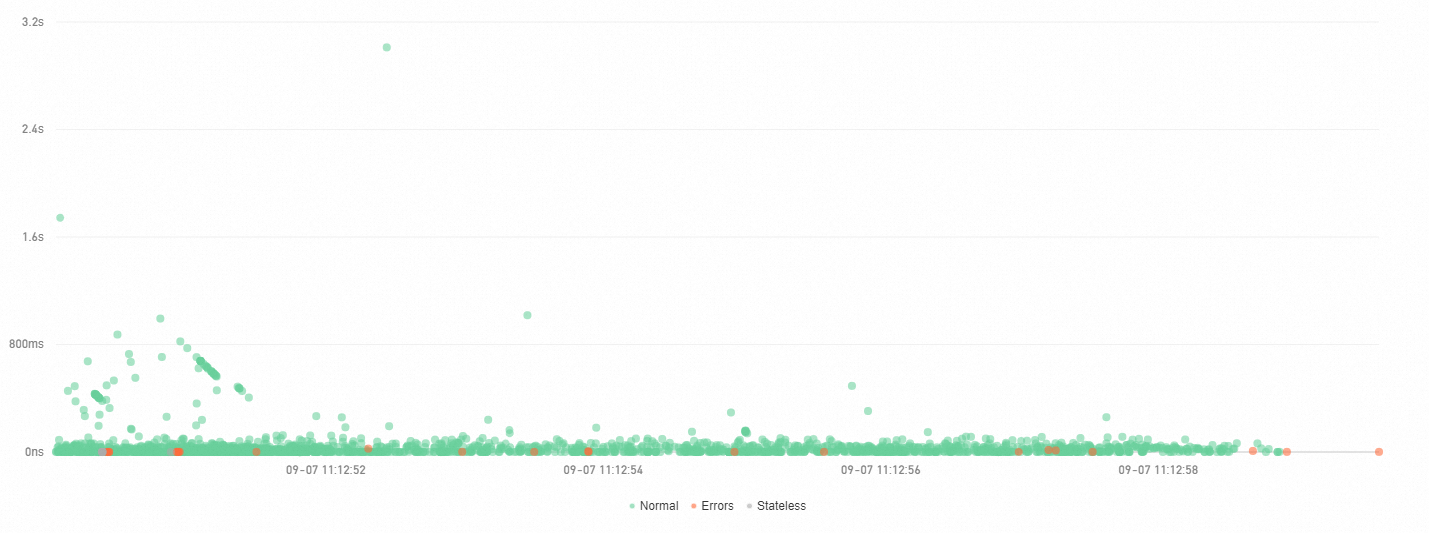
The real-time diagnostics feature is suitable for scenarios where you want to monitor application performance and identify the cause of problems within a short period of time. This topic describes how to use the real-time diagnostics feature.
Background information
If you want to monitor the performance of an application for a short period of time, such as releasing an application or performing stress tests on an application, you can use the real-time diagnostics feature. After the real-time diagnostics feature is enabled for an application, ARMS continuously monitors the application for 5 minutes and reports all the data of the traces during this period. Then, you can use the method stack waterfall chart and thread profiling to identify the causes of exceptions based on the trace that shows performance problems.
Procedure
- Log on to the ARMS console.
- In the left-side navigation pane, choose . In the top navigation bar, select a region.
- On the Applications page, click the name of the application.
- In the left-side navigation pane, choose .
Enable and disable real-time diagnostics
The first time you access the Real-time Diagnosis page, real-time diagnostics is automatically enabled. To enable real-time diagnostics in other cases, click Enable real-time diagnosis in the upper-right corner.
Real-time diagnostics is automatically enabled for 5 minutes and then disabled. To disable real-time diagnostics, click Terminate Real-time Diagnosis in the upper-right corner.
View real-time monitoring data
In the Real-time Requests Distribution and Requests by Response Time sections, you can view the statistics of the last 1,000 requests captured as of the current point in time.

In the chart of the Real-time Requests Distribution section, select a time range. Data of the selected time range can be set as visible. The chart shows data only within this time range. Click Reset in the upper-right corner of the chart and the default view can be restored.

Filter monitoring data
You can filter request monitoring data displayed on the page by operation name or IP address.
View information of traces
On the Traces and Interfaces Aggregated tabs, you can view information of all traces captured in the corresponding period. Click a trace ID to access the Link Invocation page. Use the local method stack waterfall chart and thread profiling to identify the causes of exceptions.
