The API Request page in Browser Monitoring tracks every API call your web application makes. Use it to pinpoint slow endpoints, failing requests, and error patterns before they affect users.
| Problem | Where to look |
|---|---|
| Which APIs are failing? | Success Rate tab -- ranks endpoints by success rate to surface unreliable APIs. |
| What errors are being returned? | Message tab -- groups API calls by response message, sorted by volume. |
| Which successful APIs are slowest? | Success RT tab -- ranks endpoints by average response time (RT) for successful calls. |
| Are failures also slow? | Failure RT tab -- shows average RT for failed calls alongside failure volume. |
| Is the issue regional or device-specific? | Geographical View, Terminal View, and Version View sections -- break down all metrics by location, browser, OS, device, resolution, and app version. |
Metrics
The API Request page displays four core metrics for every monitored API endpoint:
Success rate -- Percentage of calls that return a successful response.
Response messages -- Response messages returned by each API, ranked by call volume.
Average RT for successful calls -- How long successful requests take to complete, on average.
Average RT for failed calls -- How long failed requests take before returning an error.
All four metrics can be broken down by six dimensions: geographical location, browser, operating system, device, resolution, and version.
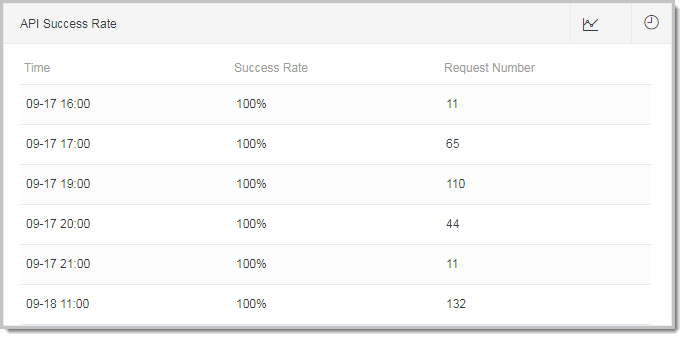
Investigate API success rates
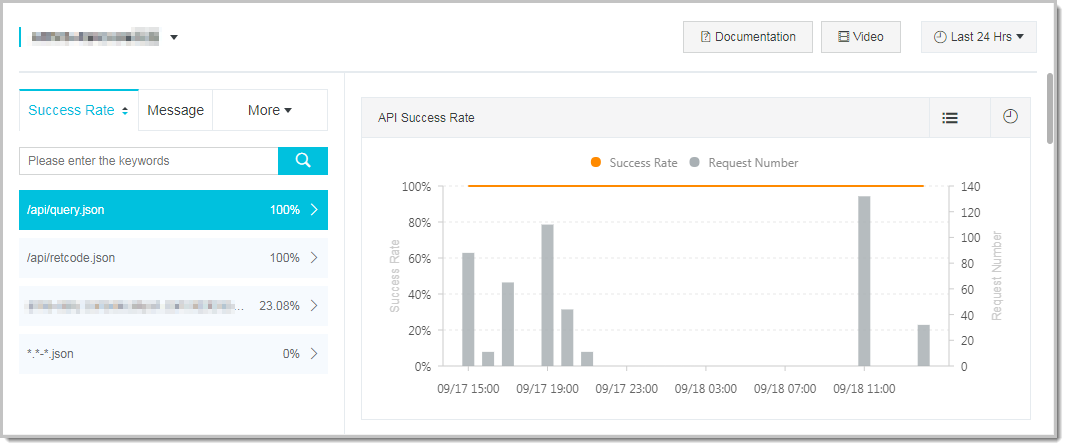
The Success Rate tab on the left side ranks all monitored APIs by their call success rate.
Select an API to view:
API Success Rate (right panel) -- A time-series chart showing the call volume and success rate over the selected time range.
API Link Trace (TOP 20) (right panel) -- The top 20 failed and successful traces for that API. Click Link Trace in the Actions column to inspect the distributed trace. Click View Details to see the full request and response data.
Trace details connect frontend API calls to backend processing. This helps determine whether an issue originates in client-side code, network latency, or the backend service. If an API shows a sudden drop in success rate, drill into the failed traces to check for backend timeouts, authentication errors, or unexpected status codes.
Analyze API response messages
The Message tab on the left side groups all API responses by their response message and ranks them by total call volume.
Select a message to open the Message Request Details panel on the right. This panel lists every API call that returned that message, sorted by call volume in descending order.
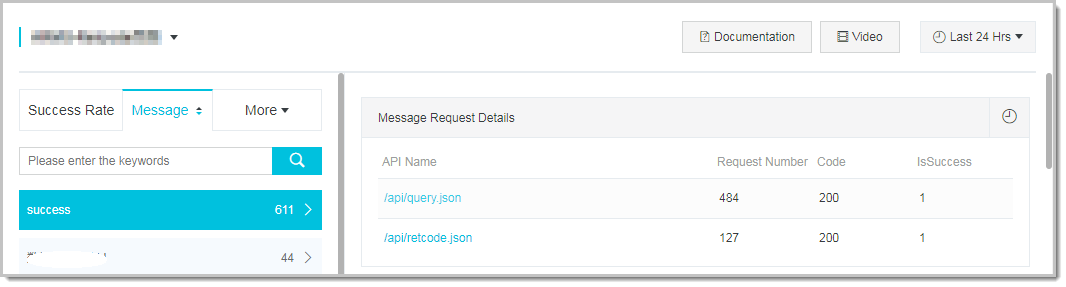
If a single error message dominates the list, that is your highest-impact debugging target.
Check response time for successful calls
The Success RT tab on the left side ranks APIs by average RT for successful calls.
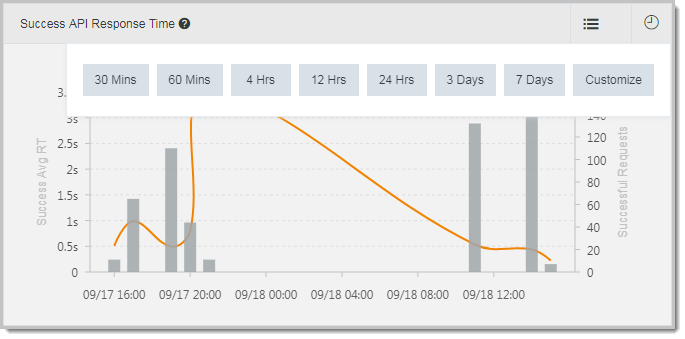
Select an API to view the Success API Response Time panel on the right, which shows:
A line chart of the average RT over time.
A bar chart of the total successful call volume over time.
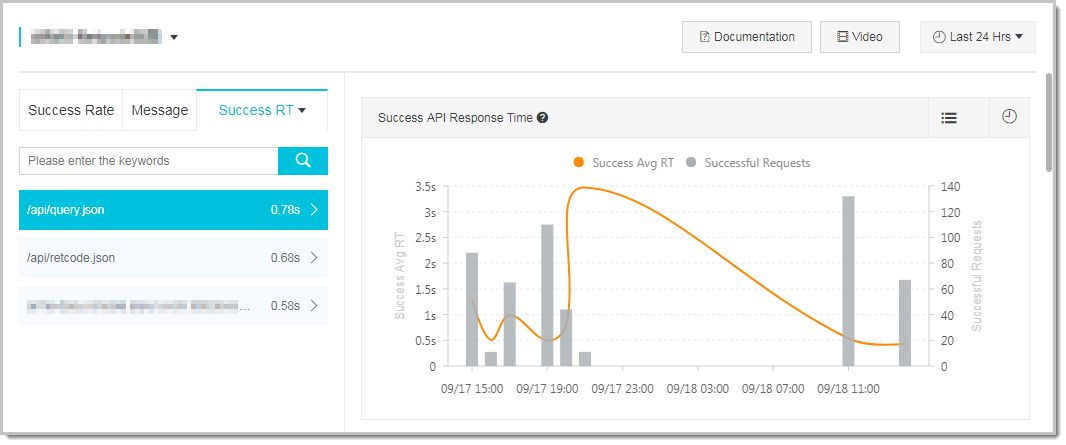
Correlate RT with call volume to distinguish genuine slowdowns from low-traffic outliers. A spike in RT with high call volume usually indicates a real performance issue.
Check response time for failed calls
The Failure RT tab on the left side ranks APIs by average RT for failed calls.
Select an API to view the Failure API Response Time panel on the right, which shows:
A line chart of the average RT for failed calls over time.
A bar chart of the total failed call volume over time.
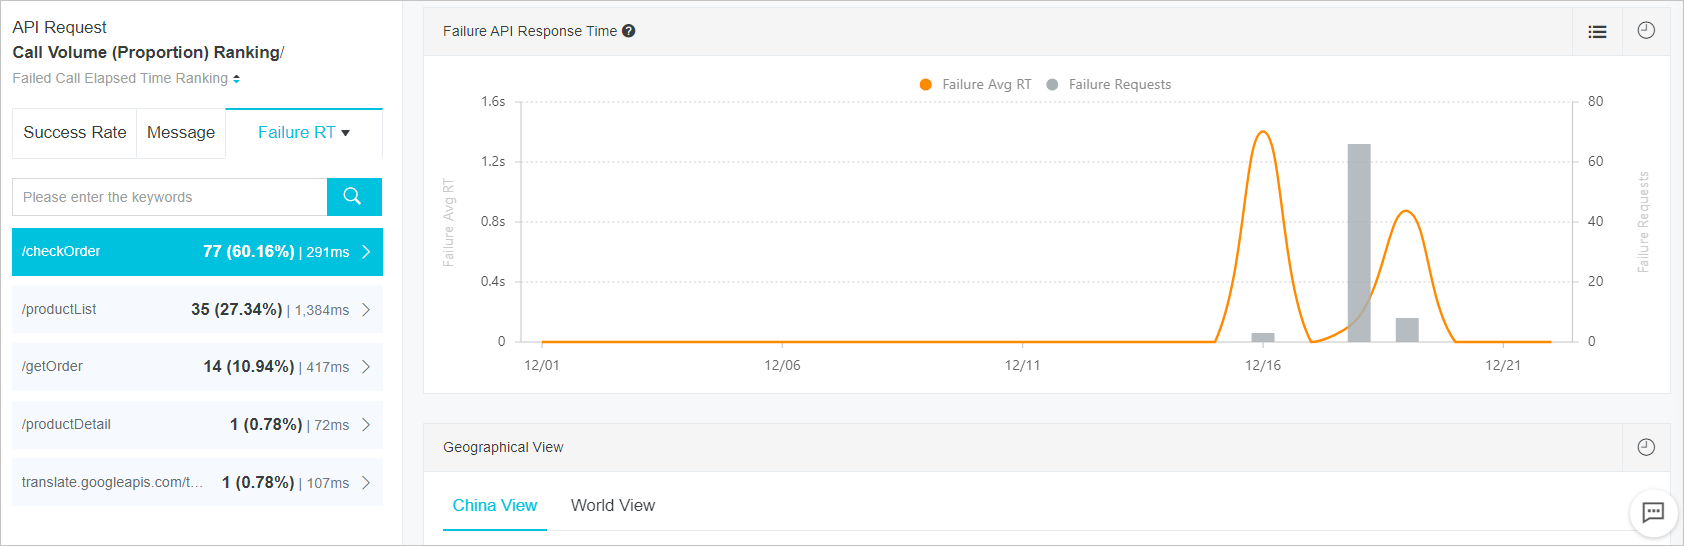
High RT on failed calls often points to backend timeouts rather than fast-returning client errors. Compare with the Message tab to check whether slow failures correlate with specific error messages.
Break down metrics by location
The Geographical View section breaks down API metrics by user location. Two tabs are available:
China View -- Statistics aggregated by province within China.
World View -- Statistics aggregated by country or region worldwide.
Use this view to identify region-specific performance or reliability issues, which may indicate CDN, DNS, or network-level problems.
Break down metrics by terminal
The Terminal View section breaks down API metrics by the client environment. Four tabs are available:
| Tab | What it shows |
|---|---|
| Browser | Metrics grouped by browser type (Chrome, Firefox, Safari, etc.) |
| OS | Metrics grouped by operating system |
| Device | Metrics grouped by device type |
| Resolution | Metrics grouped by screen resolution |
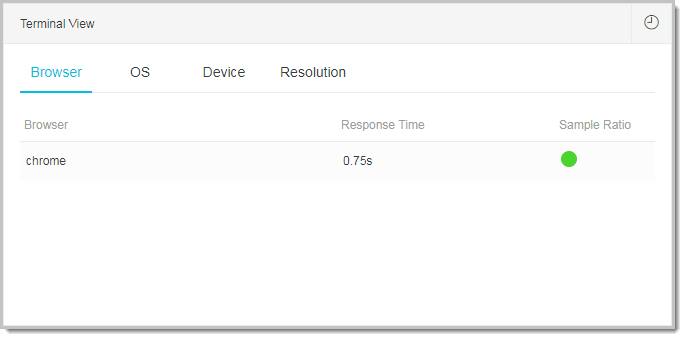
If failures or slow responses cluster around a specific browser or OS, the issue may relate to SDK compatibility or browser-specific API behavior.
Break down metrics by version
The Version View section shows metrics grouped by host version and application version.
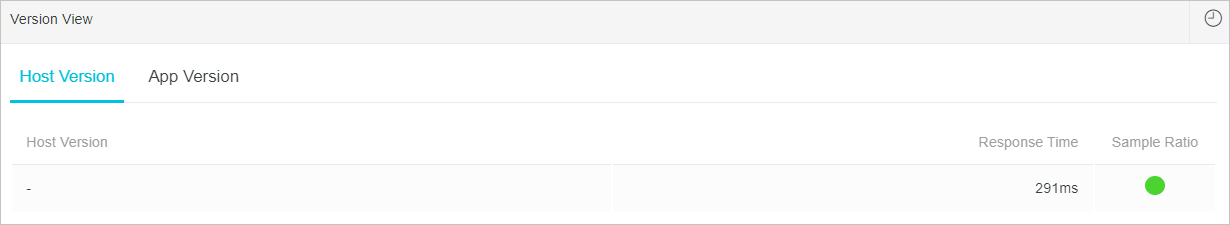
Compare the current version against previous versions after a deployment to confirm whether a new release introduced performance or reliability regressions.
Page controls
These controls are available across all tabs on the API Request page:
Sort lists -- On any left-side tab, click the arrow icon to toggle between ascending and descending order.
Switch between chart and table views -- In any right-side panel, click the list icon in the upper-right corner to toggle between chart and table views.
Set a custom time range -- In any right-side panel, click the clock icon in the upper-right corner to select a specific time range for the displayed data.