You can analyze SQL queries executed within a specific time range, view execution plan details, and identify root causes of slow SQL queries in the AnalyticDB for PostgreSQL console.
Procedure
- Log on to the AnalyticDB for PostgreSQL console.
- In the upper-left corner of the console, select the region where the instance resides.
- Find the instance that you want to manage and click its ID.
- In the left-side navigation pane, choose .
- Select a time range and click Search to view the search results.
View slow SQL queries
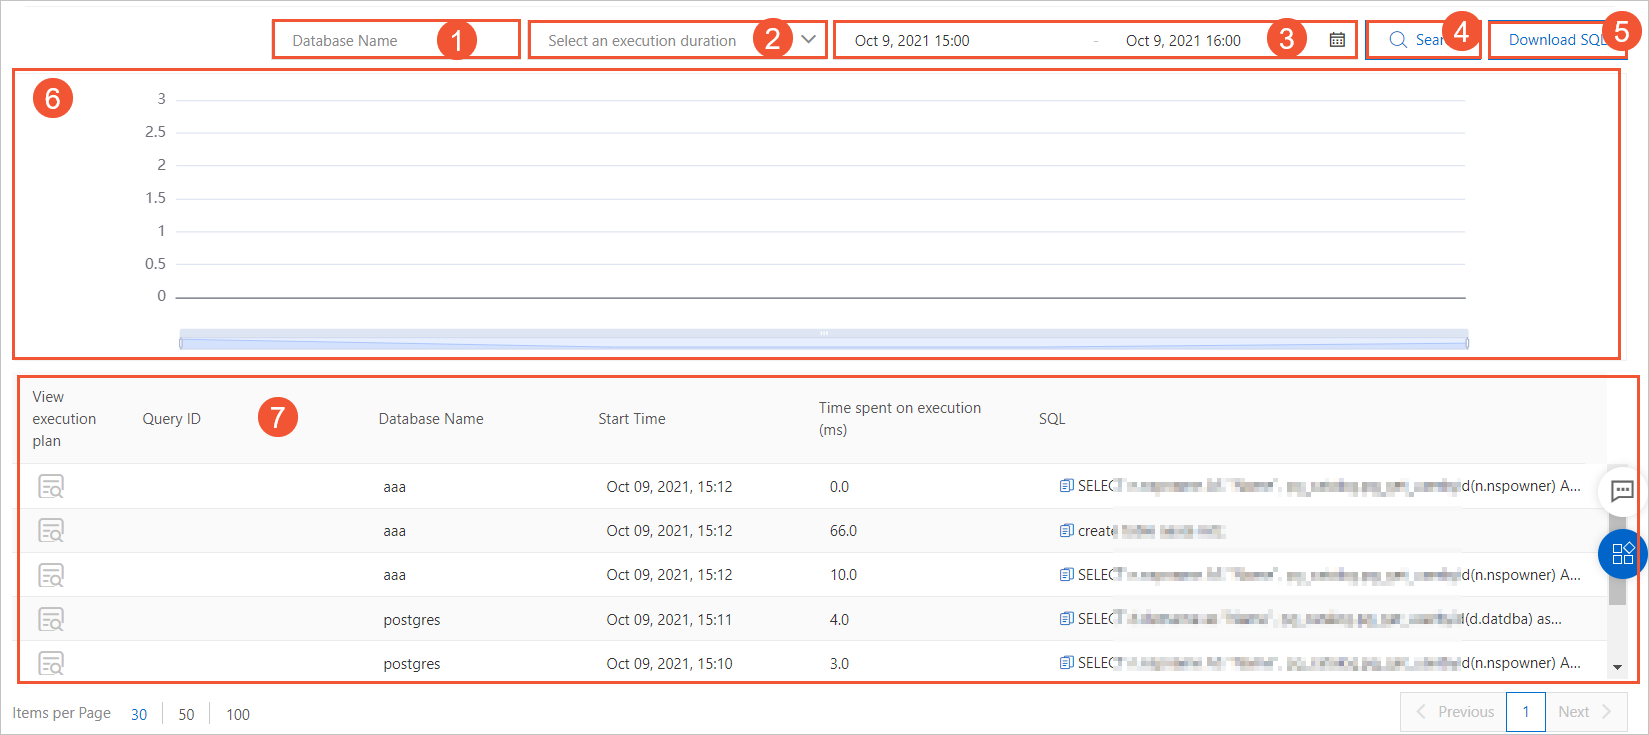
| No. | Parameter or section | Description |
|---|---|---|
| ① | Database Name | Enter the name of a database. If you want to search for slow SQL queries related to all databases in the instance, leave this parameter empty. |
| ② | Select an execution duration | Select an SQL execution duration from the drop-down list. Valid values:
|
| ③ | Time range | Select a time range to view slow SQL queries. By default, the last 1 hour is selected.
Note
|
| ④ | Search | After you specify Database Name, Select an execution duration, and time range, click Search to view the search results. |
| ⑤ | Download SQL | Click this button to download SQL query information displayed in the SQL query details section. |
| ⑥ | Line chart for SQL query quantity | Allows you to view the change trend in the number of SQL queries executed within the specified time range. |
| ⑦ | SQL query details | Allows you to view View execution plan, Query ID, Database Name, Start Time, Time spent on execution (ms), and SQL Statement of SQL queries.
Note Query ID and View execution plan are displayed only for the SQL queries that are executed for longer than 1 second.
|
View execution plan details
You can click the  icon in the View execution plan column to view execution plan details.
The following figure shows the execution plan details.
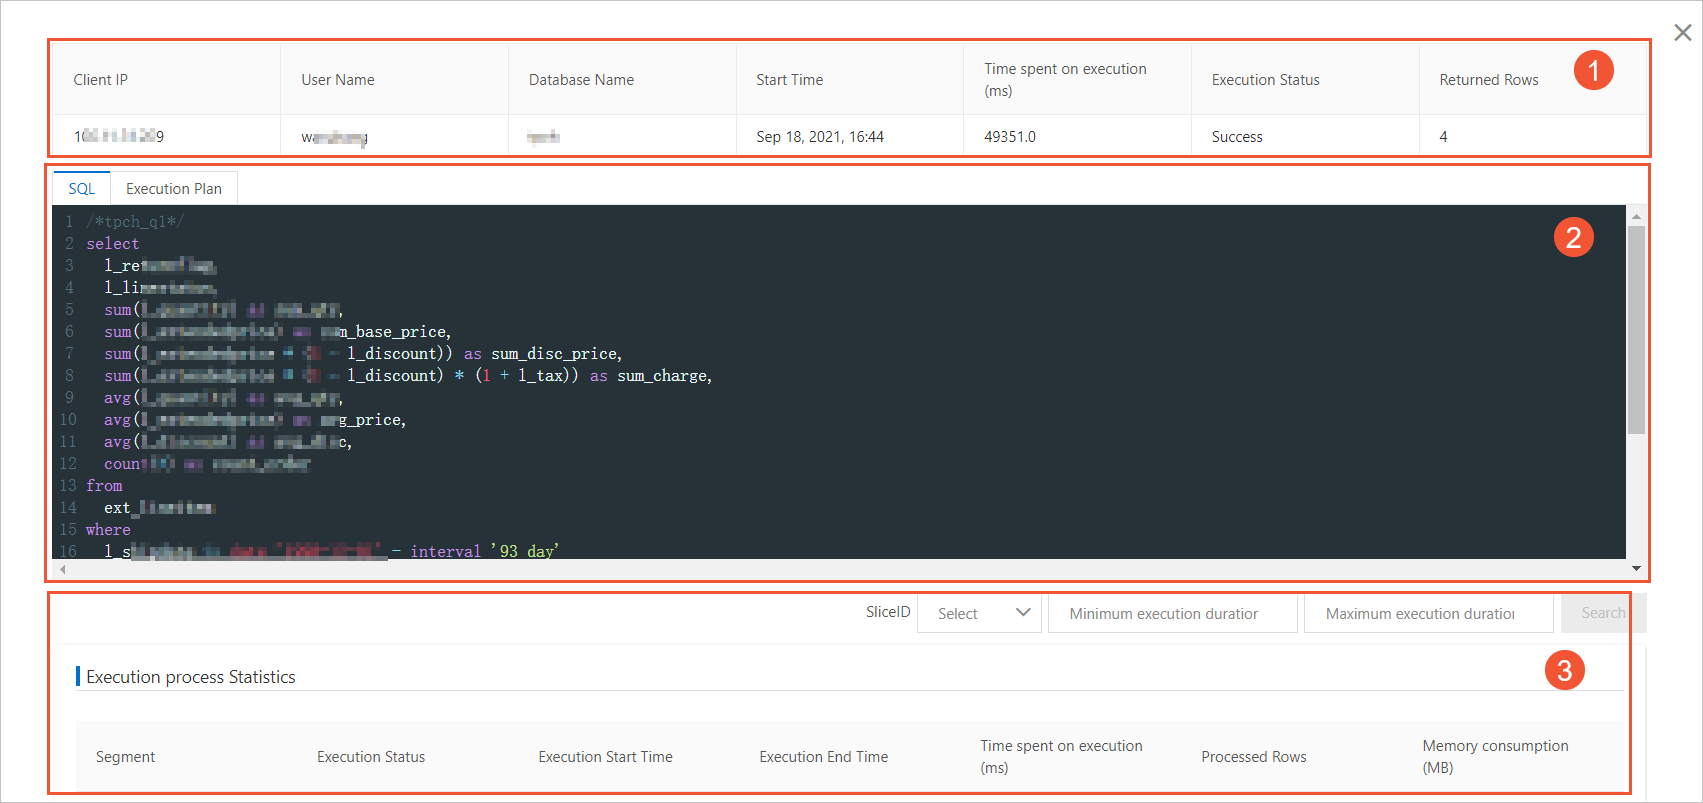
| No. | Section | Description |
|---|---|---|
| ① | Basic query information | Allows you to view Client IP, User Name, Database Name, Start Time, Time spent on execution (ms), Execution Status, and Returned Rows of the current SQL query. |
| ② | SQL Statement and Execution Plan |
|
| ③ | Execution Process Statistics | Allows you to view the execution process statistics of an execution plan, including Compute Node, Execution Status, Execution Start Time, Execution End Time, Time spent on execution (ms), Processed Rows, and Memory Consumed (MB). |