After the frontend access node of an AnalyticDB for MySQL cluster receives a query request, the cluster divides the query into multiple stages, and reads and computes data in a distributed manner on worker nodes and executor nodes. Some stages can be executed in parallel, but the other stages that have dependencies can be executed only in series. As a result, complex SQL statements may cause slow query issues. You can use stage and task details to analyze the issues by calling API operations or in the AnalyticDB for MySQL console. This topic describes how to use stage and task details to analyze queries.
Procedure
Log on to the AnalyticDB for MySQL console. In the upper-left corner of the console, select a region. In the left-side navigation pane, click Clusters. On the Clusters page, click an edition tab. Find the cluster that you want to manage and click the cluster ID.
In the left-side navigation pane, click Diagnostics and Optimization.
On the SQL Queries tab, find the query that you want to diagnose and click Diagnose in the Actions column.
Click the Stages & Tasks tab to view the details of a stage. For information about the stage query results, see the "Stage parameters" section of this topic.
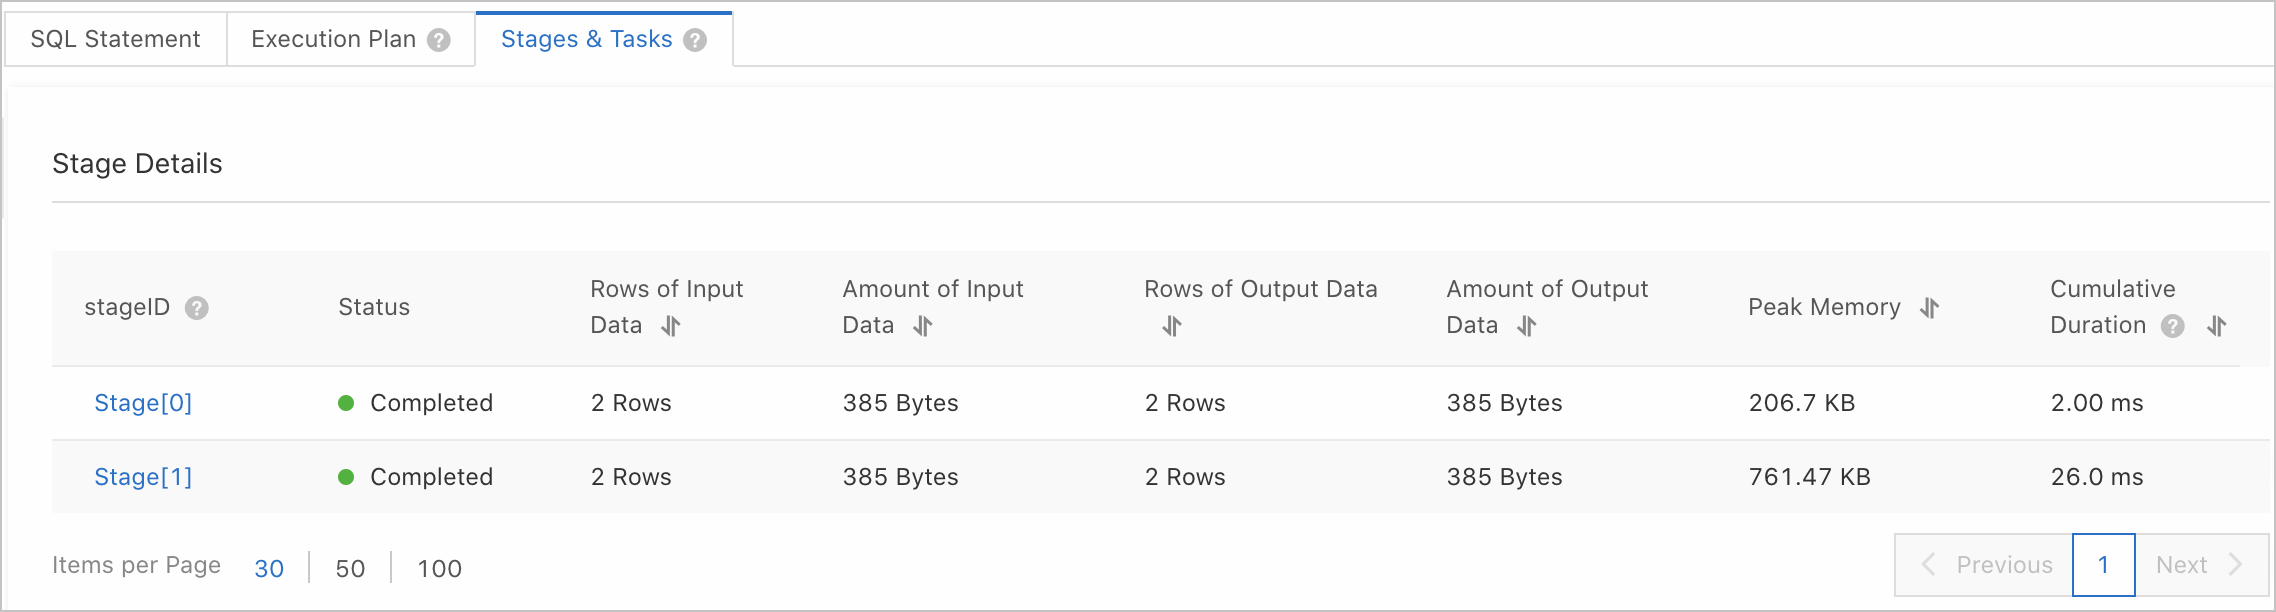
Click the stage ID to view the details of all tasks in the stage. For information about task query results, see the "Task parameters" section of this topic.
ImportantYou can view task details only for queries that consume more than 1 second.
Parameters
Stage parameters
Parameter | Description |
Stage ID | The unique identifier of the stage, which corresponds to the stage ID in the execution plan tree. |
Status | The execution status of the stage. Valid values:
|
Rows of Input Data | The number of data rows that are input to the stage. |
Amount of Input Data | The amount of data that is input to the stage. |
Rows of Output Data | The number of data rows that are output from the stage. |
Amount of Output Data | The amount of data that is output from the stage. |
Peak Memory | The peak memory usage of the stage. |
Cumulative Duration | The total amount of time that is consumed to execute all operators in the stage. You can use this parameter to identify the stages that take a long time to execute and consume a large amount of CPU resources. When you compare the cumulative duration with the query duration, you must consider the concurrency of stages. |
Task parameters
Parameter | Description |
Task ID | The unique identifier of the task. Example: |
Status | The execution status of the task. Valid values:
|
Amount of Input Data | The number of data rows that are input to the task and the amount of input data. You can sort the amount of input data for all tasks to check whether data skew occurs on the input data of the stage. Data skew may be caused by inappropriate field settings of GROUP or JOIN clauses. To resolve this issue, trace back to the upstream stage of the stage to which the current task belongs. Note If the specified distribution fields are inappropriate, data may be unevenly distributed among worker nodes. This is called a data skew. |
Amount of Output Data | The number of data rows that are output from the task and the amount of output data. You can check whether combined fields exist in the GROUP or JOIN clause of the SQL statement based on the attributes of the Aggregation or Join node in the operator plan tree of the current stage. For example, |
Peak Memory | The peak memory usage of the task. The peak memory is proportional to the amount of input data. You can use this parameter to check whether query failures are caused by unbalanced distribution of input data. |
Duration of Reading Table Data | The cumulative amount of time that is consumed by all TableScan operators of the stage to read table data. This parameter is a cumulative value that involves multiple nodes and threads and cannot be compared with the query duration. If you compare this parameter with the cumulative duration, you can determine how many computing resources of a stage are spent on data scans. |
Amount of Read Table Data | The number of data rows and the amount of data that are read by all TableScan operators of the stage. You can sort the amount of read table data for all tasks to check whether data skew occurs on the source table data. If data skew occurs, you can check whether the data skew is caused by distribution fields in the AnalyticDB for MySQL console. For more information, see Data modeling diagnostics. |
Created At | The time when the task is created. |
Queuing Duration | The amount of queue time of the task before execution. |
Ended At | The time when the task ends. |
Interval Between Start and End Time | The interval between the creation time and end time of the task. For example, if a task is created at 2022-12-12 12:00:00 and ends at 2022-12-12 12:00:04, the start and end time interval is 4 seconds. If you compare this parameter with the query duration, you can identify the main cause of slow execution. For example, if the query duration is 6 seconds and the start and end time interval is 4 seconds, the current stage is the main reason why the query took a long time to execute. For more information, see the "Examples for calculating task duration and concurrency" section of this topic. |
Cumulative Duration | The total amount of time that is consumed by all threads of all the tasks in the stage. For more information, see the "Examples for calculating task duration and concurrency" section of this topic. |
Computing Time Ratio | The ratio of data computing duration to the subtask lifecycle. This parameter can be calculated by using the following formula: Computing time ratio = (Cumulative duration/Subtask concurrency)/Interval between start and end time. In this formula, (Cumulative duration/Subtask concurrency) indicates the average amount of time that is consumed by each thread to compute data. The start and end time interval includes the actual data computing time, subtask queuing duration, and network latency. For more information, see the "Examples for calculating task duration and concurrency" section of this topic. Note A longer start and end time interval results in a smaller computing time ratio. In this case, you need to identify the operators that consume a long period of time. A shorter start and end time interval results in a larger computing time ratio. In this case, you need to focus on issues like queuing and network latency. |
Subtask Concurrency | The number of threads that concurrently execute the task on a node. For more information, see the "Examples for calculating task duration and concurrency" section of this topic. |
Execution Node | The IP address of the node on which the task is executed. If long tail issues occur on the same node for multiple queries, you must check this node. Note A long tail issue in AnalyticDB for MySQL refers to the situation where some tasks take a much longer time to execute than the other tasks. |
Examples for calculating task duration and concurrency
In this example, the start and end time interval, cumulative duration, computing time ratio, and subtask concurrency of Task 2.1 are calculated.
Task 2.1 belongs to Stage 2. Assume that Stage 2 consists of four operators: StageOutput, Join, TableScan, and RemoteSource. The following figure shows the operator tree diagram of Stage 2.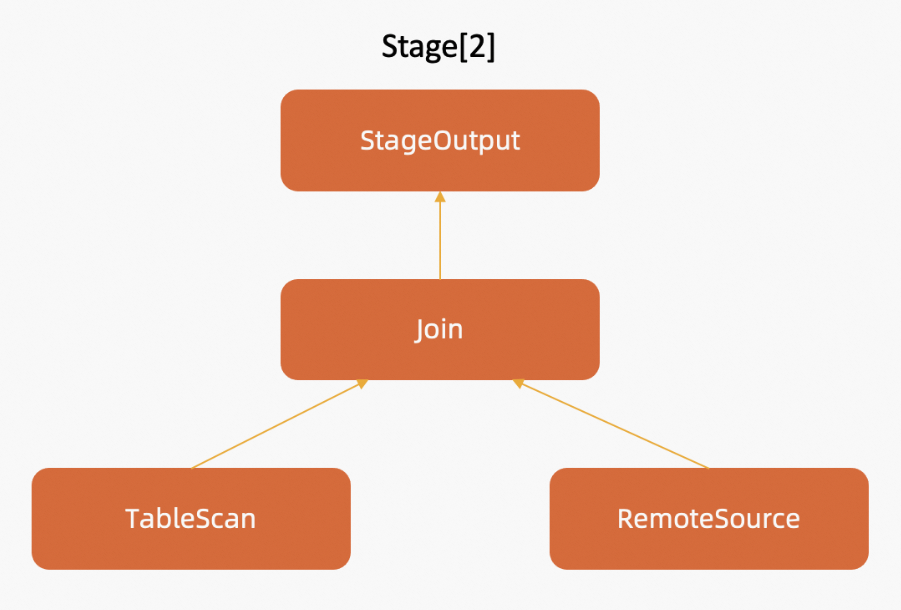
These operators are concurrently executed on multiple nodes in the direction of the arrows. On the node whose IP address is 192.168.12.23, Task 2.1 is executed with four concurrent threads. The four threads respectively consume 5, 5, 6, and 6 seconds to compute data, as shown in the following figure.
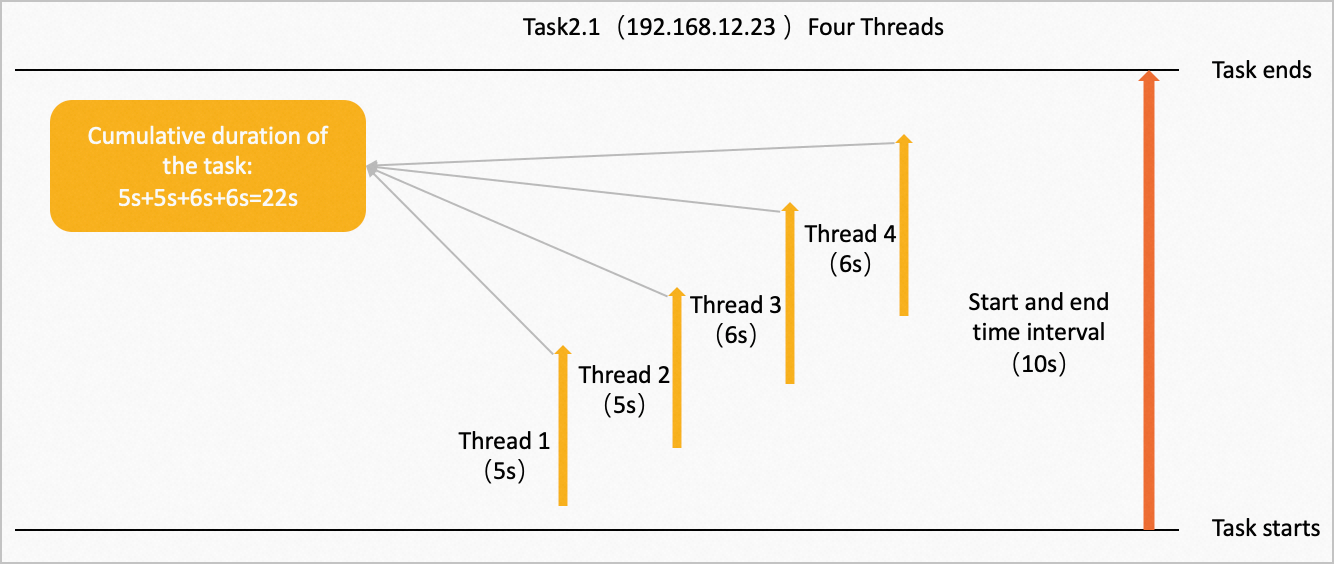
Cumulative duration of the task: 5s + 5s + 6s + 6s = 22s.
Start and end time interval: 10s.
Computing time ratio: (22s/4)/10s = 0.55.
Related operations
Operation | Description |
Queries the execution information about an SQL statement. | |
Queries the execution information about distributed tasks in a stage of a query. |