If you want to comprehensively monitor and audit Kubernetes API (KubeAPI) operations in Service Mesh (ASM), you can use the KubeAPI operation audit feature of ASM to record and trace routine operations of users. After you enable the mesh audit feature for an ASM instance, you can click Overview, Operation Audit, Operation Overview, or Operation Details tabs on the Mesh Audit page to view details of audit reports. This way, you can better trace and analyze key events and obtain the statistics about operations on resources. This helps you improve mesh security and traceability and optimize security policies and resource management to ensure the stability and efficient use of your service mesh.
Prerequisites
Background information
Resources in this topic refer to Istio resources, including virtual services, Istio gateways, destination rules, envoy filters, sidecar proxies, and service entries.
After you enable the mesh audit feature, you are charged for the audit logs that are generated. For more information about the billing method, see Pay-by-feature.
Step 1: Enable the KubeAPI operation audit feature
For new ASM instances
Log on to the ASM console. In the left-side navigation pane, choose .
On the Mesh Management page, click Create ASM Instance. On the Create Service Mesh page, select Enable Mesh Audit in the Mesh Audit section, configure the parameters based on your business requirements, and then click Create Service Mesh.
For the descriptions of the configuration items, see Create an ASM instance.
NoteBy default, a project named mesh-log-${Mesh-ID} is created in Simple Log Service, and a Logstore named audit-${Mesh-ID} is created in the project to store audit logs.
For existing ASM instances
Log on to the ASM console. In the left-side navigation pane, choose .
On the Mesh Management page, click the name of the ASM instance. In the left-side navigation pane, choose .
On the Mesh Audit page, select Enable Mesh Audit and click OK.
Step 2: View KubeAPI audit reports
Log on to the ASM console. In the left-side navigation pane, choose .
On the Mesh Management page, click the name of the ASM instance. In the left-side navigation pane, choose .
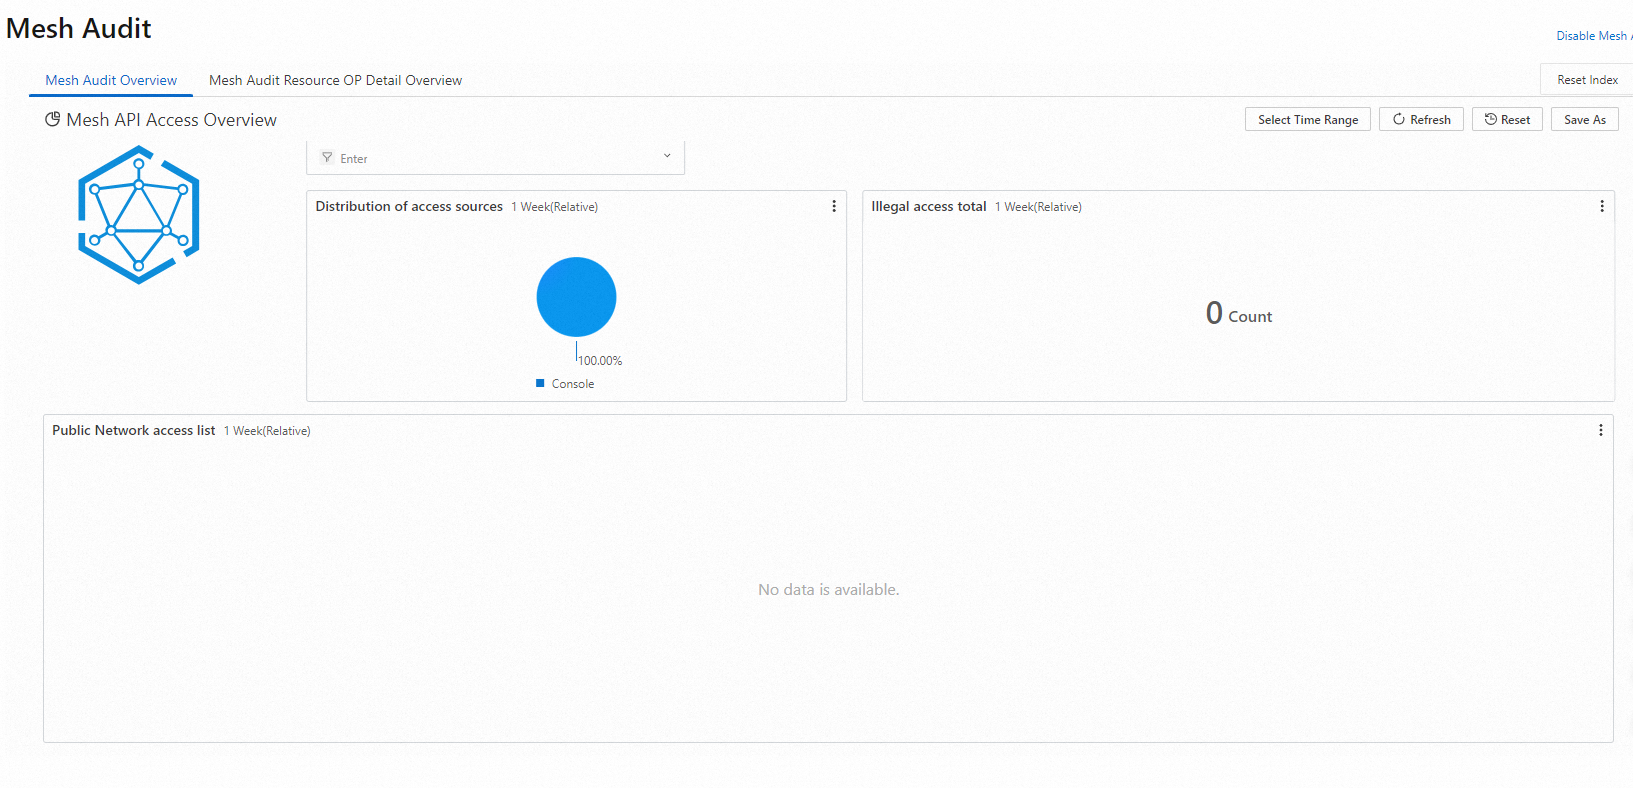
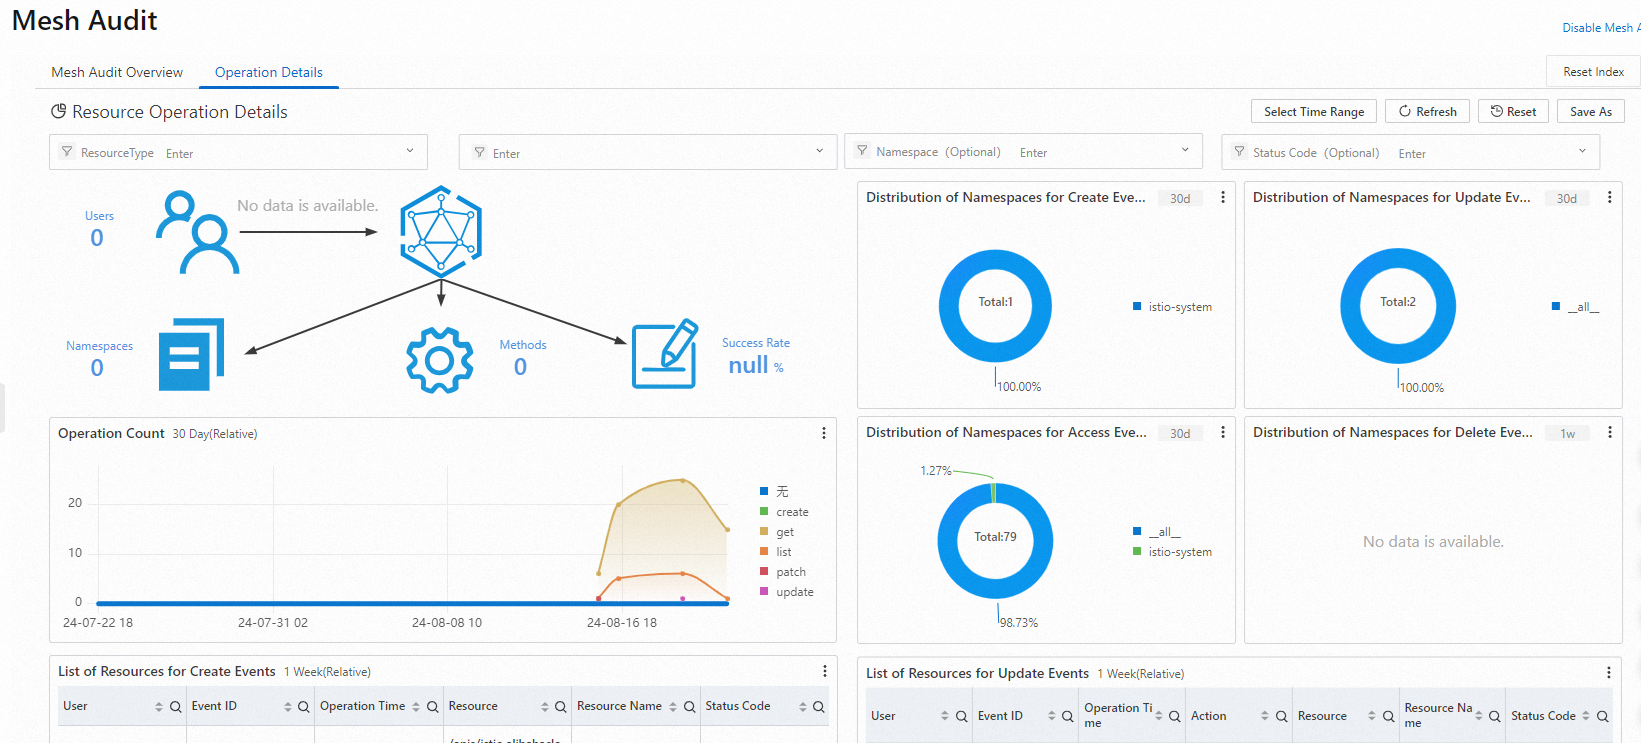
On the Mesh Audit page, click the Mesh Audit Overview or Operation Details tab based on your business requirements to view details of audit reports.
Mesh Audit Overview: On this tab, you can view the details about Kubernetes API operations called in an ASM instance.
Operation Details: On this tab, you can view detailed information about the operations on specific resources in the ASM instance.
You can specify the resource type to query detailed information about operations on such resources in real time. You can view the total number of operations, the distribution of operations by namespace, the operation trends over time, and the detailed operation lists.
Related operations
View audit logs
If you want to query and analyze audit logs, go to the Simple Log Service console to view detailed logs.
Log on to the Simple Log Service console.
In the Projects section, click the project that is named mesh-log-${Mesh-ID}.
Click the audit-${Mesh-ID} Logstore that is created for the ASM instance. Then, click Search & Analyze to view the audit logs.
 Note
NoteWhen you enable the mesh audit feature, a Logstore that is named audit-${Mesh-ID} is created in the specified project.
By default, indexes are already set up in the Logstore. Do not modify the indexes. Otherwise, reports may fail to be generated from the audit logs.
By default, API server audit logs of ASM are stored for 30 days in the corresponding Logstore in Simple Log Service. For more information about how to change the default retention period of logs, see Manage a logstore.
You can use the following methods to query audit logs:
To query the operations that are performed by a RAM user, enter the RAM user ID in the search box and click Search & Analyze.
To query the operations that are performed on a resource, enter the resource name in the search box and click Search & Analyze.
To query the operations that are performed by system components, enter
NOT user.username: node NOT user.username: serviceaccount NOT user.username: apiserver NOT user.username: kube-scheduler NOT user.username: kube-controller-managerin the search box and click Search & Analyze.
For more information about the query and statistical methods, see Log search overview.
Set alerts
Simple Log Service allows you to set alerts to monitor the operations that are performed on specific resources in real time. Alerts can be sent by using SMS messages, DingTalk chatbots, emails, custom webhooks, and Message Center of the Alibaba Cloud Management Console. For more information, see Alerting.
You can also execute query statements in audit reports to query audit logs.
Example 1: Set an alert on command execution on containers
A company requires strict access control on its ASM instances and does not allow users to log on to or run commands on containers in the ASM instances. The company wants to be notified of an alert immediately if a user attempts to log on to or run commands on a container. The alert notification is required to include the following information: the container that was logged on to, executed commands, operator, event ID, operation time, and source IP address.
Sample query statement:
verb : create and objectRef.subresource:exec and stage:  ResponseStarted | SELECT auditID as "Event ID", date_format(from_unixtime(__time__), '%Y-%m-%d %T' ) as "Operation time",  regexp_extract("requestURI", '([^\?]*)/exec\?.*', 1)as "Resource",  regexp_extract("requestURI", '\?(.*)', 1)as "Command" ,"responseStatus.code" as "Status code",
 CASE
 WHEN "user.username" != 'kubernetes-admin' then "user.username"
 WHEN "user.username" = 'kubernetes-admin' and regexp_like("annotations.authorization.k8s.io/reason", 'RoleBinding') then regexp_extract("annotations.authorization.k8s.io/reason", ' to User "(\w+)"', 1)
 ELSE 'kubernetes-admin' END
 as "Username",
CASE WHEN json_array_length(sourceIPs) = 1 then json_format(json_array_get(sourceIPs, 0)) ELSE  sourceIPs END
as "Source IP address" limit 100
Sample conditional expression:
Operation event =~ ".*"
Example 2: Set an alert on failed Internet access to the API server
To prevent attacks on an ASM instance that allows Internet access, a company monitors the number of connections from a source IP address over the Internet and the connection failure rate. The company requires alerts to be sent immediately when the number of connections from the source IP address and the connection failure rate exceed the specified thresholds. For example, the company requires an alert to be sent when the number of connections from a source IP address reaches 10 and more than five of the connections failed. The alert notification is required to include the following information: the source IP address, the region to which the source IP address belongs, and whether the source IP address is risky.
Sample query statement:
* | select ip as "Source IP address", total as "Number of Internet connection requests", round(rate * 100, 2) as "Connection failure rate", failCount as "Number of unauthorized Internet connection requests", CASE when security_check_ip(ip) = 1 then 'yes' else 'no' end  as "Whether the IP address is risky",  ip_to_country(ip) as "Country", ip_to_province(ip) as "Province", ip_to_city(ip) as "City", ip_to_provider(ip) as "ISP" from (select CASE WHEN json_array_length(sourceIPs) = 1 then json_format(json_array_get(sourceIPs, 0)) ELSE  sourceIPs END
as ip, count(1) as total,
sum(CASE WHEN "responseStatus.code" < 400 then 0
ELSE 1 END) * 1.0 / count(1) as rate,
count_if("responseStatus.code" = 403) as failCount
from log  group by ip limit 10000) where ip_to_domain(ip) != 'intranet'  having "Number of connections" > 10 and "Connection failure rate" > 50 ORDER by "Number of connections" desc limit 100
Sample conditional expression:
Source IP address =~ ".*"
Recreate a deleted project
If you accidentally delete a project that is used for mesh audit from Simple Log Service but still want to use the mesh audit feature, you must recreate the deleted project.
Log on to the ASM console. In the left-side navigation pane, choose .
On the Mesh Management page, click the name of the ASM instance. In the left-side navigation pane, choose .
On the Mesh Audit page, click Recreate in the Rebuild Mesh Audit message.
The recreated project is named after the project name before deletion and suffixed with the timestamp when the project is recreated.
References
For more information about how to send alerts to alert contacts in a timely manner for changes of important resources, see Configure audit alerts for operations on ASM resources.
You can configure zero-trust security capabilities such as workload identity, peer authentication, request authentication, and authorization policies in ASM to manage mesh resources in a more fine-grained manner and improve mesh security. For more information, see Overview of zero trust security.