When traffic spikes, service overload, resource exhaustion, or malicious requests threaten availability, local rate limiting caps the request volume at each sidecar proxy to protect individual service instances.
Each sidecar proxy enforces rate limits independently using the token bucket algorithm. Tokens are added to a bucket at a fixed interval, and each inbound request consumes one token. When no tokens remain, the proxy rejects new requests with HTTP 429 (Too Many Requests).
Prerequisites
A Service Mesh (ASM) instance that meets the following version requirements:
Enterprise Edition or Ultimate Edition: version 1.14.3 or later. To upgrade, see Update an ASM instance.
Standard Edition: version 1.9 or later. Standard Edition only supports native Istio rate limiting. The reference document varies with the Istio version. For the latest version, see Enabling rate limits using Envoy in the Istio documentation.
Automatic sidecar proxy injection is enabled for the
defaultnamespace in your Container Service for Kubernetes (ACK) cluster. For details, see the "Enable automatic sidecar proxy injection" section of Manage global namespaces.The HTTPBin and sleep sample services are deployed, and the sleep service can reach the HTTPBin service. For deployment instructions, see Deploy the HTTPBin application.
Scenario 1: Rate limit by service port
Apply a rate limit to all requests on port 8000 of the HTTPBin service, regardless of the request path.
Step 1: Create a local rate limiting rule
Log on to the ASM console. In the left-side navigation pane, choose Service Mesh > Mesh Management.
On the Mesh Management page, click the name of your ASM instance. In the left-side navigation pane, choose Traffic Management Center > Rate Limiting.
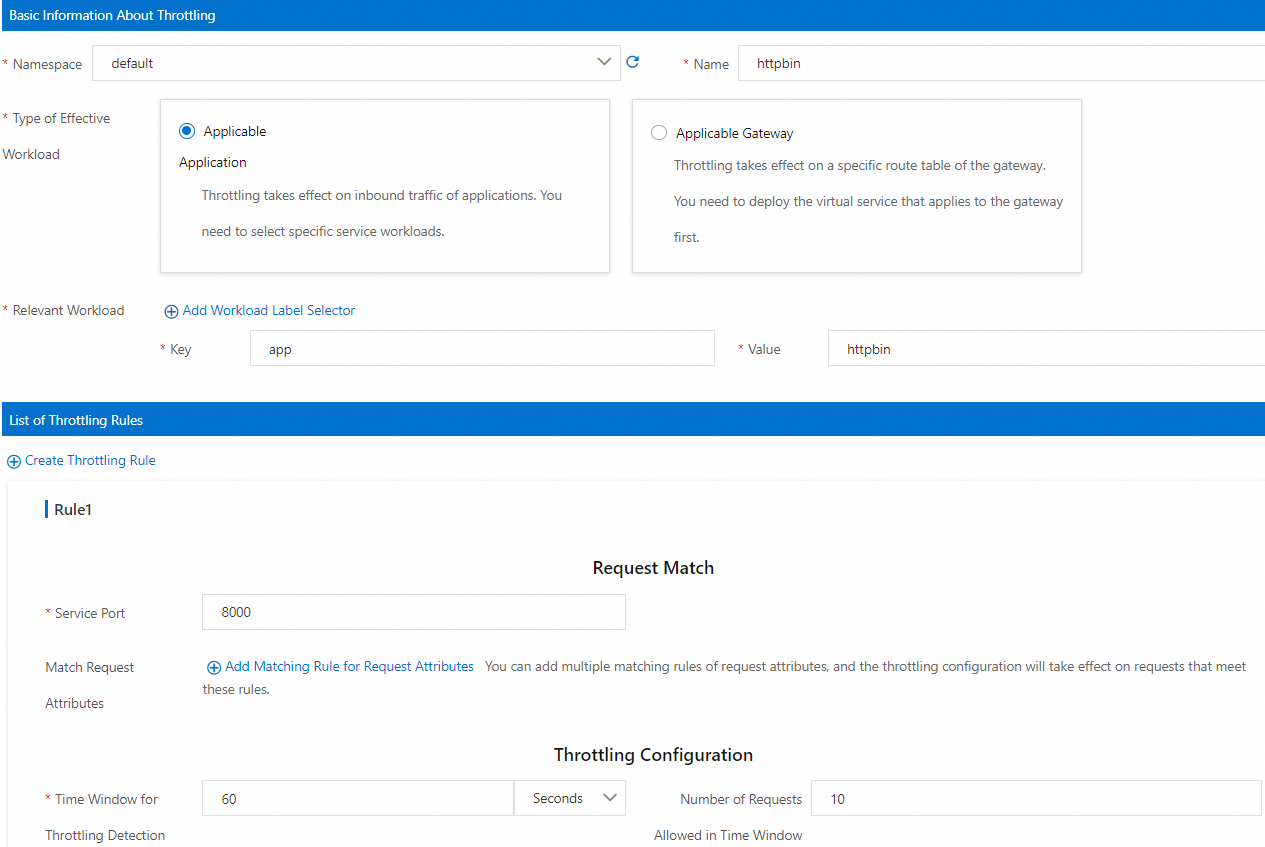
Click Create and configure the following parameters:
Section Parameter Value Basic Information About Throttling Namespace Select default. Name Enter httpbin. Type of Effective Workload Select Applicable Application. Relevant Workload Set Key to app and Value to httpbin. List of Throttling Rules Service Port Enter 8000 (the HTTP port declared in the HTTPBin Kubernetes Service). Throttling Configuration Set Time Window for Throttling Detection to 60 seconds and Number of Requests Allowed in Time Window to 10. Click OK.
Step 2: Verify the rate limit
Open a shell in the sleep pod:
kubectl exec -it deploy/sleep -- shSend 10 requests to exhaust the token bucket:
for i in $(seq 1 10); do curl -v http://httpbin:8000/headers; doneSend one more request:
curl -v http://httpbin:8000/headersExpected output:
   *   Trying 172.16.245.130:8000...
   * Connected to httpbin (172.16.245.130) port 8000
   > GET /headers HTTP/1.1
   > Host: httpbin:8000
   > User-Agent: curl/8.5.0
   > Accept: */*
   >
   < HTTP/1.1 429 Too Many Requests
   < x-local-rate-limit: true
   < content-length: 18
   < content-type: text/plain
   < date: Tue, 26 Dec 2023 08:02:58 GMT
   < server: envoy
   < x-envoy-upstream-service-time: 2
The
429 Too Many Requestsresponse with thex-local-rate-limit: trueheader confirms that local rate limiting is active.
Scenario 2: Rate limit by port and request path
Apply a rate limit only to requests on port 8000 that target the /headers path. Requests to other paths, such as /get, pass through without rate limiting.
Step 1: Create a local rate limiting rule
Log on to the ASM console. In the left-side navigation pane, choose Service Mesh > Mesh Management.
On the Mesh Management page, click the name of your ASM instance. In the left-side navigation pane, choose Traffic Management Center > Rate Limiting.
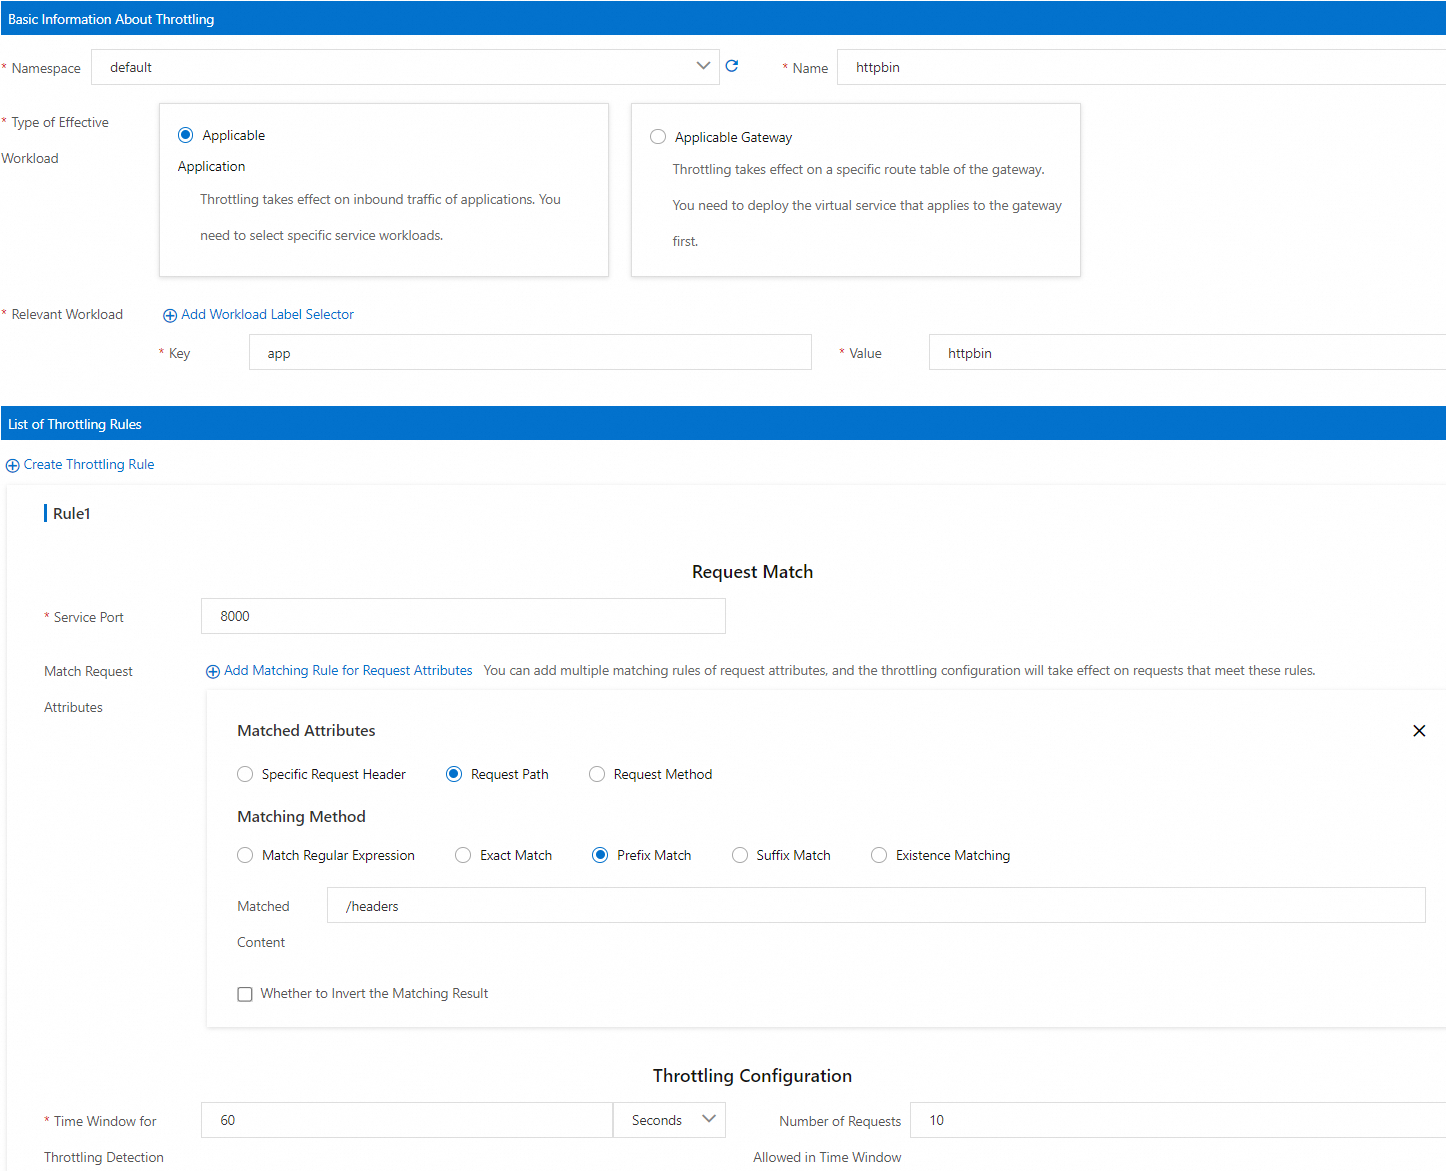
Click Create and configure the following parameters:
Section Parameter Value Basic Information About Throttling Namespace Select default. Name Enter httpbin. Type of Effective Workload Select Applicable Application. Relevant Workload Set Key to app and Value to httpbin. List of Throttling Rules Service Port Enter 8000. Match Request Attributes Set Matched Attributes to Request Path, Matching Method to Prefix Match, and Matched Content to /headers.Throttling Configuration Set Time Window for Throttling Detection to 60 seconds and Number of Requests Allowed in Time Window to 10. Click OK.
Step 2: Verify the rate limit
Open a shell in the sleep pod:
kubectl exec -it deploy/sleep -- shSend 10 requests to the
/headerspath to exhaust the token bucket:for i in $(seq 1 10); do curl -v http://httpbin:8000/headers; doneSend one more request to
/headers:curl -v http://httpbin:8000/headersExpected output:
   *   Trying 172.16.245.130:8000...
   * Connected to httpbin (172.16.245.130) port 8000
   > GET /headers HTTP/1.1
   > Host: httpbin:8000
   > User-Agent: curl/8.5.0
   > Accept: */*
   >
   < HTTP/1.1 429 Too Many Requests
   < x-local-rate-limit: true
   < content-length: 18
   < content-type: text/plain
   < date: Tue, 26 Dec 2023 08:02:58 GMT
   < server: envoy
   < x-envoy-upstream-service-time: 2
The
429response confirms that requests to/headersare rate limited.Send a request to a different path to confirm it is unaffected:
curl -v http://httpbin:8000/getExpected output:
   *   Trying 192.168.243.21:8000...
   * Connected to httpbin (192.168.243.21) port 8000 (#0)
   > GET /get HTTP/1.1
   > Host: httpbin:8000
   > User-Agent: curl/8.1.2
   > Accept: */*
   >
   < HTTP/1.1 200 OK
   < server: envoy
   < date: Thu, 11 Jan 2024 03:46:11 GMT
   < content-type: application/json
   < content-length: 431
   < access-control-allow-origin: *
   < access-control-allow-credentials: true
   < x-envoy-upstream-service-time: 1
   <
   {
     "args": {},
     "headers": {
       "Accept": "*/*",
       "Host": "httpbin:8000",
       "User-Agent": "curl/8.1.2",
       "X-Envoy-Attempt-Count": "1",
       "X-Forwarded-Client-Cert": "By=spiffe://cluster.local/ns/default/sa/httpbin;Hash=be10819991ba1a354a89e68b3bed1553c12a4fba8b65fbe0f16299d552680b29;Subject=\"\";URI=spiffe://cluster.local/ns/default/sa/sleep"
     },
     "origin": "127.0.0.6",
     "url": "http://httpbin:8000/get"
   }
The
200 OKresponse confirms that requests to other paths are not subject to the rate limiting rule.
Collect and query rate limiting metrics
Local rate limiting generates the following Envoy metrics:
| Metric | Description |
|---|---|
envoy_http_local_rate_limiter_http_local_rate_limit_enabled | Total requests evaluated by the rate limiter |
envoy_http_local_rate_limiter_http_local_rate_limit_ok | Requests that had tokens available and were allowed |
envoy_http_local_rate_limiter_http_local_rate_limit_rate_limited | Requests that found no tokens available (not necessarily rejected) |
envoy_http_local_rate_limiter_http_local_rate_limit_enforced | Requests that were actually rejected (HTTP 429 returned) |
To expose rate limiting metrics from the sidecar proxy:
Enable the sidecar proxy to report rate limiting metrics by configuring
proxyStatsMatcher. Select Regular Expression Match and enter.*http_local_rate_limit.*. Alternatively, click Add Local Throttling Metrics. For details, see the "proxyStatsMatcher" section in Configure sidecar proxies.Redeploy the HTTPBin service to apply the updated sidecar configuration. For details, see the "(Optional) Redeploy workloads" section in Configure sidecar proxies.
Apply one of the rate limiting rules from Scenario 1 or Scenario 2, then run request tests to generate metrics.
Query the rate limiting metrics from the HTTPBin sidecar proxy:
kubectl exec -it deploy/httpbin -c istio-proxy -- curl localhost:15020/stats/prometheus|grep http_local_rate_limitExample output:
   envoy_http_local_rate_limiter_http_local_rate_limit_enabled{} 37
   envoy_http_local_rate_limiter_http_local_rate_limit_enforced{} 17
   envoy_http_local_rate_limiter_http_local_rate_limit_ok{} 20
   envoy_http_local_rate_limiter_http_local_rate_limit_rate_limited{} 17
Set up Prometheus alerts for rate limiting
After enabling metrics, configure Prometheus to collect them and create alert rules for rate limiting events. The following example uses Managed Service for Prometheus.
In Managed Service for Prometheus, connect your data plane ACK cluster to the Alibaba Cloud ASM component, or upgrade the component to the latest version. This ensures that rate limiting metrics are collected by Managed Service for Prometheus. For integration details, see Component management.
NoteIf you already use a self-managed Prometheus instance to collect ASM metrics (see Monitor ASM instances by using a self-managed Prometheus instance), skip this step.
Create an alert rule for rate limiting events. For the full setup procedure, see Use a custom PromQL statement to create an alert rule. The following table shows key parameter examples:
Parameter Example Description Custom PromQL Statements (sum by(namespace, pod_name) (increase(envoy_http_local_rate_limiter_http_local_rate_limit_enforced[1m]))) > 0Counts rate-limited requests per pod in the last minute. Fires an alert when the count exceeds 0. Alert Message Local throttling occurs! Namespace: {{$labels.namespace}}, Pod that triggers throttling: {{$labels.pod_name}}. Number of requests that are throttled in the current 1 minute: {{ $value }}Includes the namespace, pod name, and throttled request count.
FAQ
Why does my local rate limiting rule not take effect?
The service does not use HTTP: Local rate limiting works only with HTTP and HTTP-based protocols (gRPC, dubbo3). Verify that your service uses a supported protocol and that the protocol is declared correctly in the Kubernetes Service definition. For guidance, see How do I specify the protocol of a service in a standard manner?
A Sidecar CRD overrides inbound traffic configuration: ASM automatically configures an inbound traffic listener for sidecar proxies based on the service declaration. Local rate limiting rules depend on this default configuration.
If you used a Sidecar CRD to modify the default inbound traffic configuration (for example, to expose a localhost application to other pods), the inbound port may differ from the service port. In this case, set the rate limiting rule to use the port defined in the Sidecar CRD instead of the original service port.
For example, if the following Sidecar CRD maps inbound traffic to port 80:
apiVersion: networking.istio.io/v1beta1
kind: Sidecar
metadata:
  name: localhost-access
  namespace: default
spec:
  ingress:
    - defaultEndpoint: '127.0.0.1:80'
      port:
        name: http
        number: 80
        protocol: HTTP
  workloadSelector:
    labels:
      app: httpbin
Set the service port in your rate limiting rule to 80 instead of 8000.
What to read next
To match requests by query parameters in rate limiting rules (ASM 1.19.0+), see Description of ASMLocalRateLimiter fields.
To apply a service-wide rate limit across all instances, see Use ASMGlobalRateLimiter to configure global throttling for inbound traffic.
To configure rate limiting on an ingress gateway instead of a sidecar proxy, see Configure local throttling on an ingress gateway or Configure global throttling on an ingress gateway.
To gradually increase traffic to a service after deployment, see Use the warm-up feature.
To protect services from cascading failures, see Configure the connectionPool field to implement circuit breaking.