Configure alert rules in the console to handle alerts promptly.
Concepts
Monitoring metrics
Artificial Intelligence Recommendation (AIRec) calculates data metrics to summarize the dynamic status of an instance. These metrics are continuously generated by the AIRec system, and you do not need to manage the calculation process.
Cloud Monitor
Cloud Monitor is an Alibaba Cloud product that AIRec uses to sync its monitoring metrics. In the Cloud Monitor console, you can view metrics and configure alerts. If you use AIRec, you can view its monitoring metrics in Cloud Monitor on a free trial basis.
Dashboard
A dashboard is a page in Cloud Monitor that displays one or more metrics as charts. You can adjust the size and position of these charts.
Chart
A chart is a visual representation of one or more monitoring metrics.
RAM user authorization
By default, RAM users do not have permission to view Cloud Monitor metrics. To grant this permission, you must log on to your Alibaba Cloud account and authorize the RAM user. For more information, see Log Monitoring Authorization.
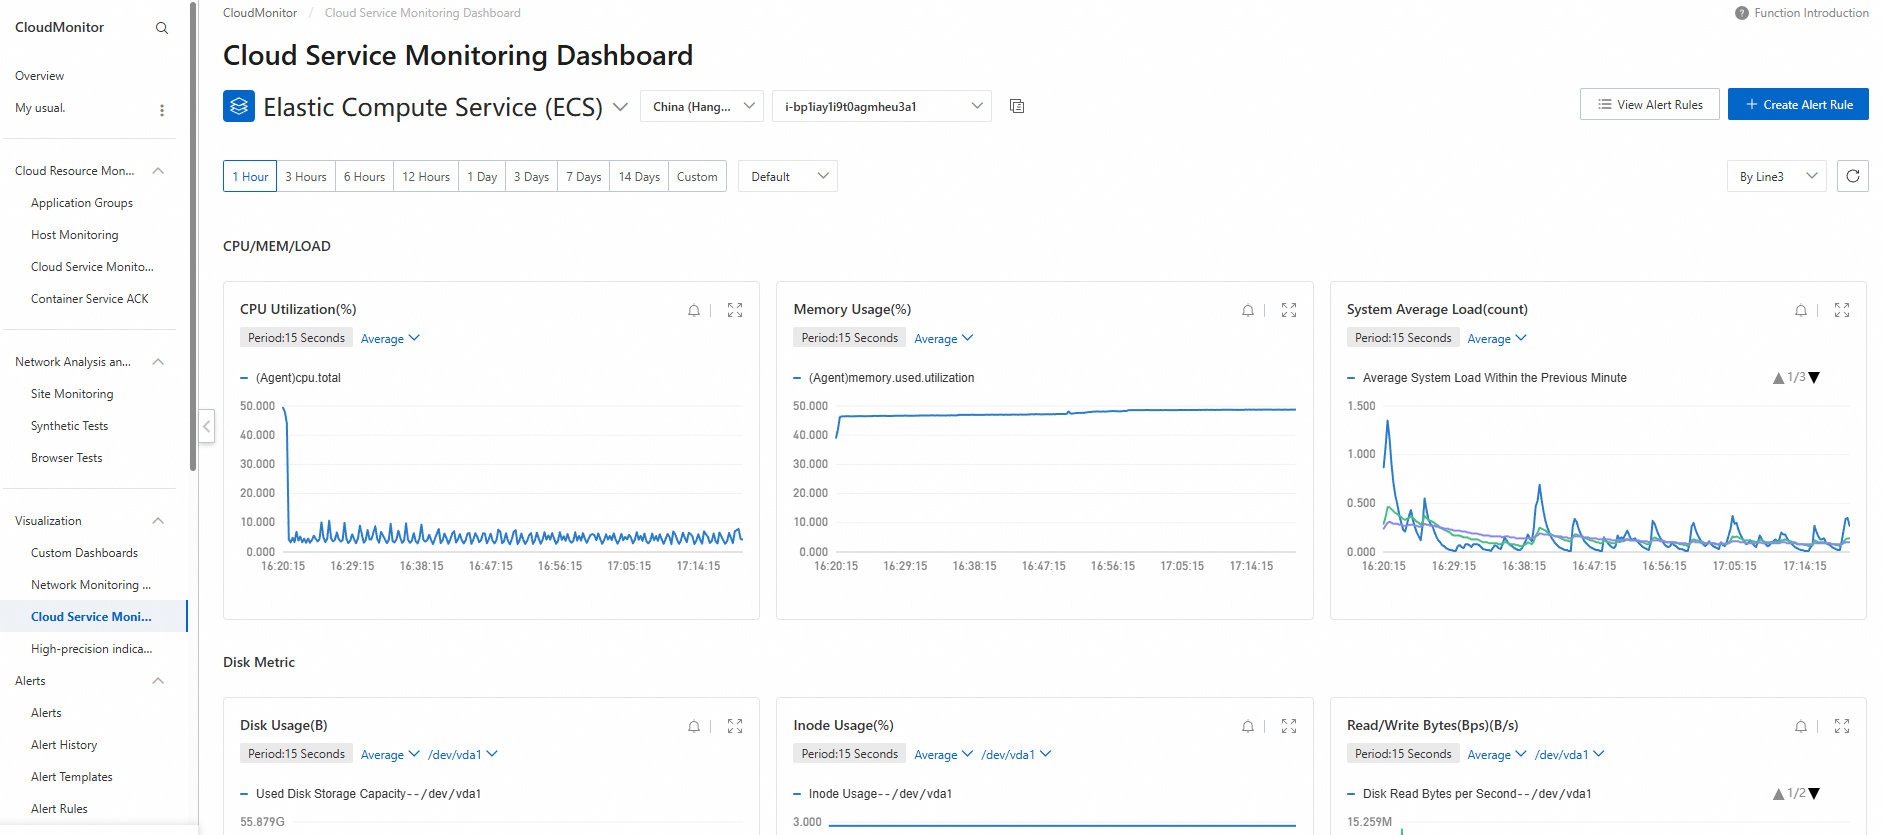
Quickly view instance metrics
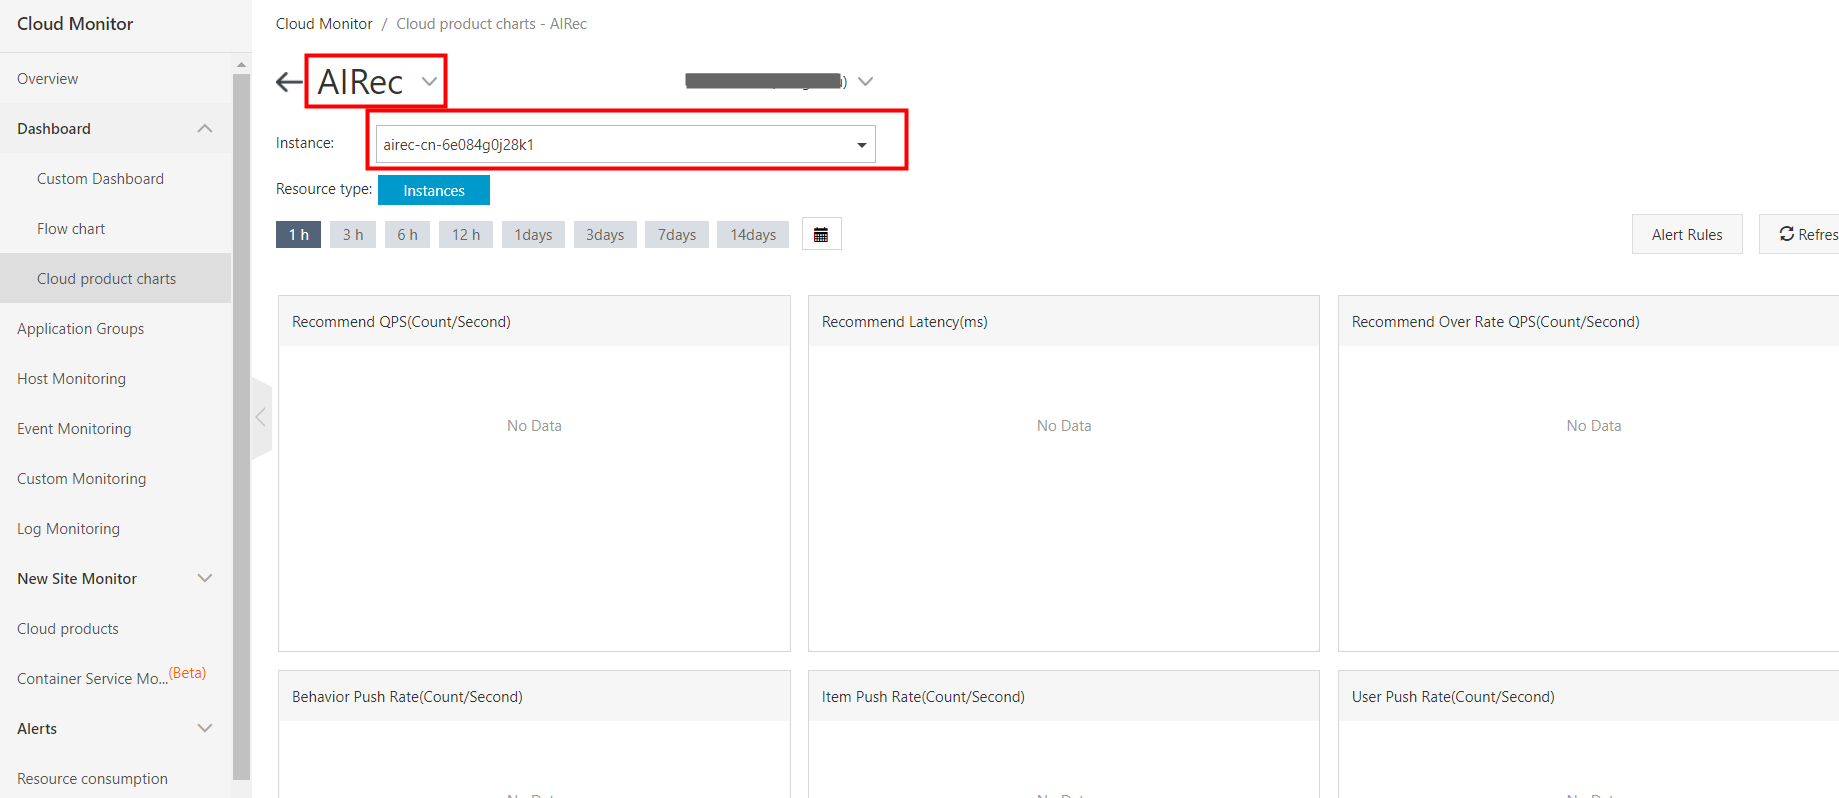
You can quickly view all metrics for an instance. Log on to the Cloud Monitor console using the Alibaba Cloud account that is associated with your AIRec instance. Then, select the instance whose metrics you want to view, as shown in the following figure.
Metrics
AIRec calculates and summarizes the following metrics. For example, for the metric that measures the rate of failed behavioral data pushes, you can set an alert rule that is triggered if ① the number of failed pushes ② is greater than or equal to ③ N times within a 20-minute period. All three parameters are adjustable.
|
Metric |
Unit |
Metric calculation epoch |
Description |
|
Query request volume |
QPS |
1 minute |
The average number of recommendation requests per second during the calculation epoch. QPS stands for queries per second. |
|
Average latency of recommendation API |
Seconds |
1 minute |
The average response time for recommendation requests. |
|
Throttled query request volume |
QPS |
1 minute |
The average number of requests that fail per second due to throttling. |
|
User table usage ratio |
Percentage |
10 minutes |
The ratio of the actual number of uploaded users to the purchased quota at the time of statistics collection. |
|
Item table usage ratio |
Percentage |
10 minutes |
The ratio of the actual number of uploaded items to the purchased quota at the time of statistics collection. |
|
User push rate |
Count/Second |
1 minute |
Average number of user upload commands per second. |
|
Item push rate |
Count/Second |
1 minute |
The average number of items uploaded per second. All upload commands are counted. |
|
Behavior push rate |
Count/Second |
1 minute |
The average number of behaviors uploaded per second. All upload commands are counted. |
|
Failed user push rate |
Count/Second |
1 minute |
The average number of failed user uploads per second. All upload commands are counted. |
|
Failed item push rate |
Count/Second |
1 minute |
The average number of failed item uploads per second. All upload commands are counted. |
|
Failed behavior push rate |
Count/Second |
1 minute |
The average number of failed behavior uploads per second. All upload commands are counted. |
|
Average latency of behavioral data |
Seconds |
1 minute |
The average time interval between the bhv_time of behavioral data and the upload time. This metric reflects the latency of behavioral data uploads. |
The following alert rules are recommended:
|
Alert name |
Alert condition |
Notes |
|
Throttled query QPS |
>0 |
Check the purchased QPS quota and the actual usage. |
|
User table usage ratio |
>90 |
Check the purchased quota and the actual number of uploads. |
|
Item table usage ratio |
>90 |
Check the purchased quota and the actual number of uploads. |
|
Behavioral data latency |
>7200 |
High latency in behavioral data uploads affects recommendation performance. |
Configuration steps
Log on using your Alibaba Cloud account or an authorized RAM user and follow these steps:1. Go to the Overview page of the AIRec console. The Alert History area, which displays historical alert information, is in the upper-right corner. If you have not configured any alert rules, click "Configure Alert Rules".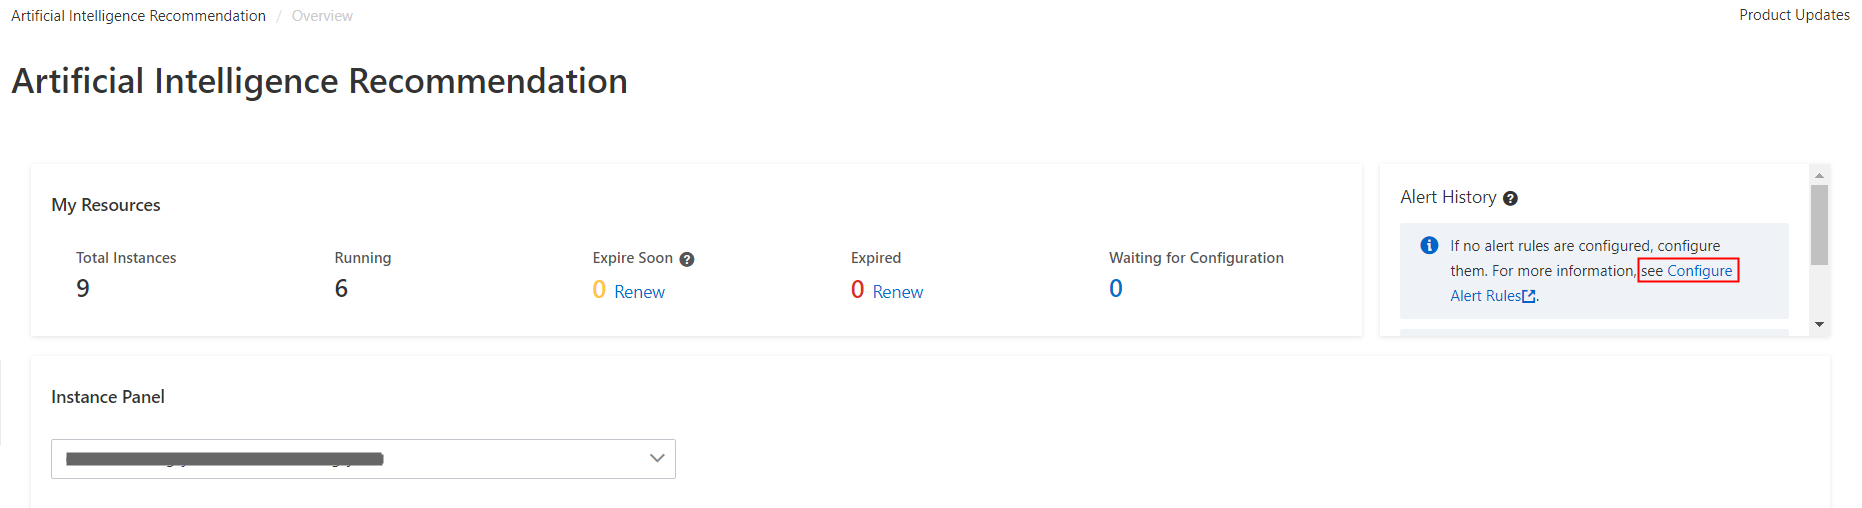
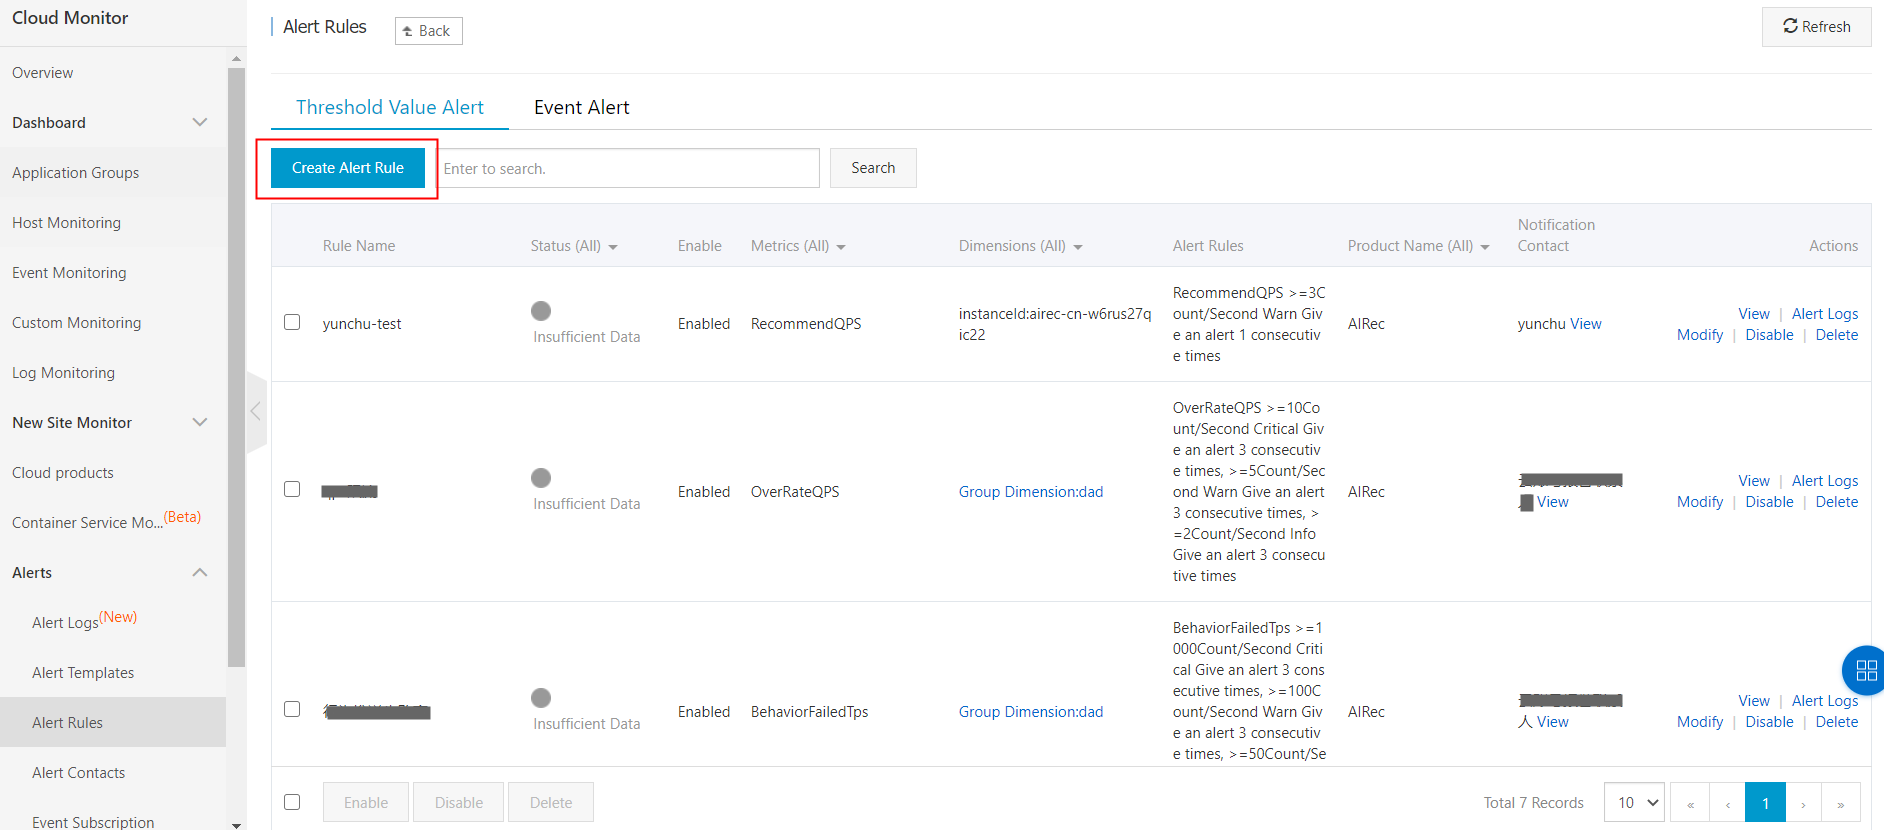
2. Click Create Alert Rule.
3. Associate resources.In the Resource Range section, if you select All Instances, an alert notification is sent when any AIRec instance under the current Alibaba Cloud account triggers the alert rule. If you select Specific Instances, an alert notification is sent only when the selected instances trigger the alert rule. To create a rule for a dimension group, go to the resource page for that group.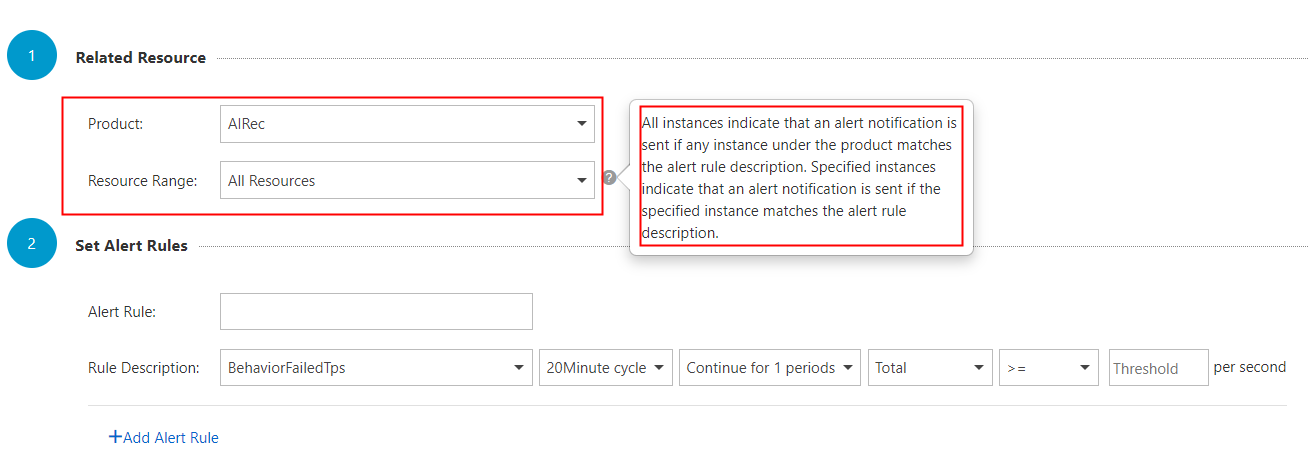
4. Set the alert rule.The Mute For parameter specifies the time interval before resending a notification for an alert that has not been resolved.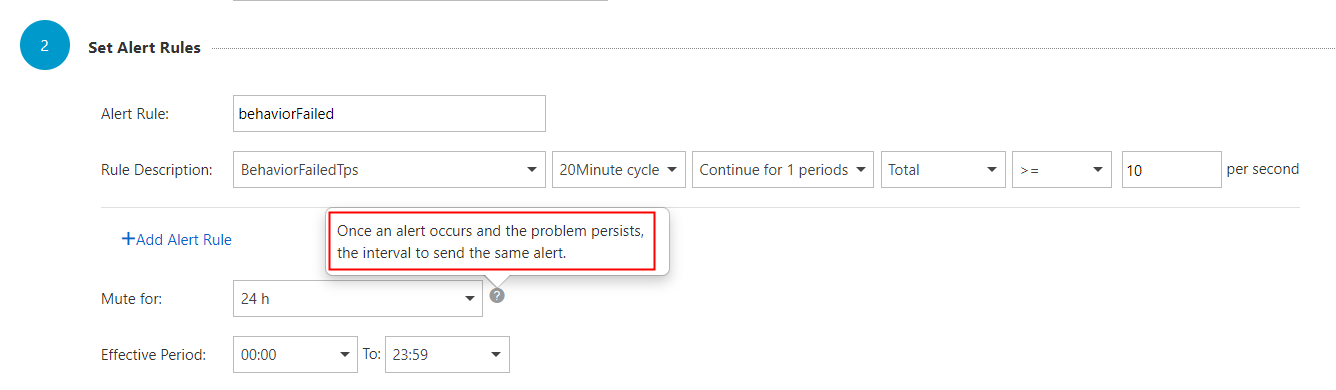
5. Alert notifications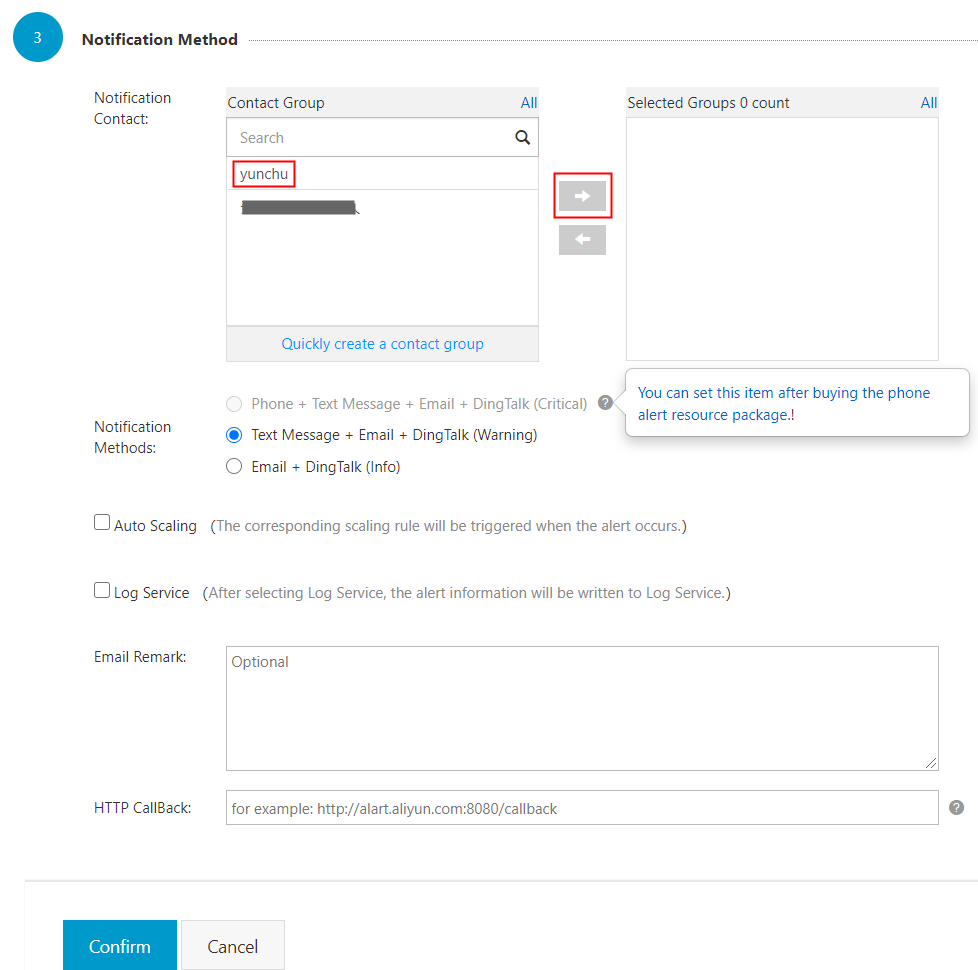
Other Cloud Monitor features
Custom dashboards
Cloud Monitor console
Log on to the Cloud Monitor console using the account that is associated with your AIRec instance. Find the dashboard editing menu, as shown in the following figure.
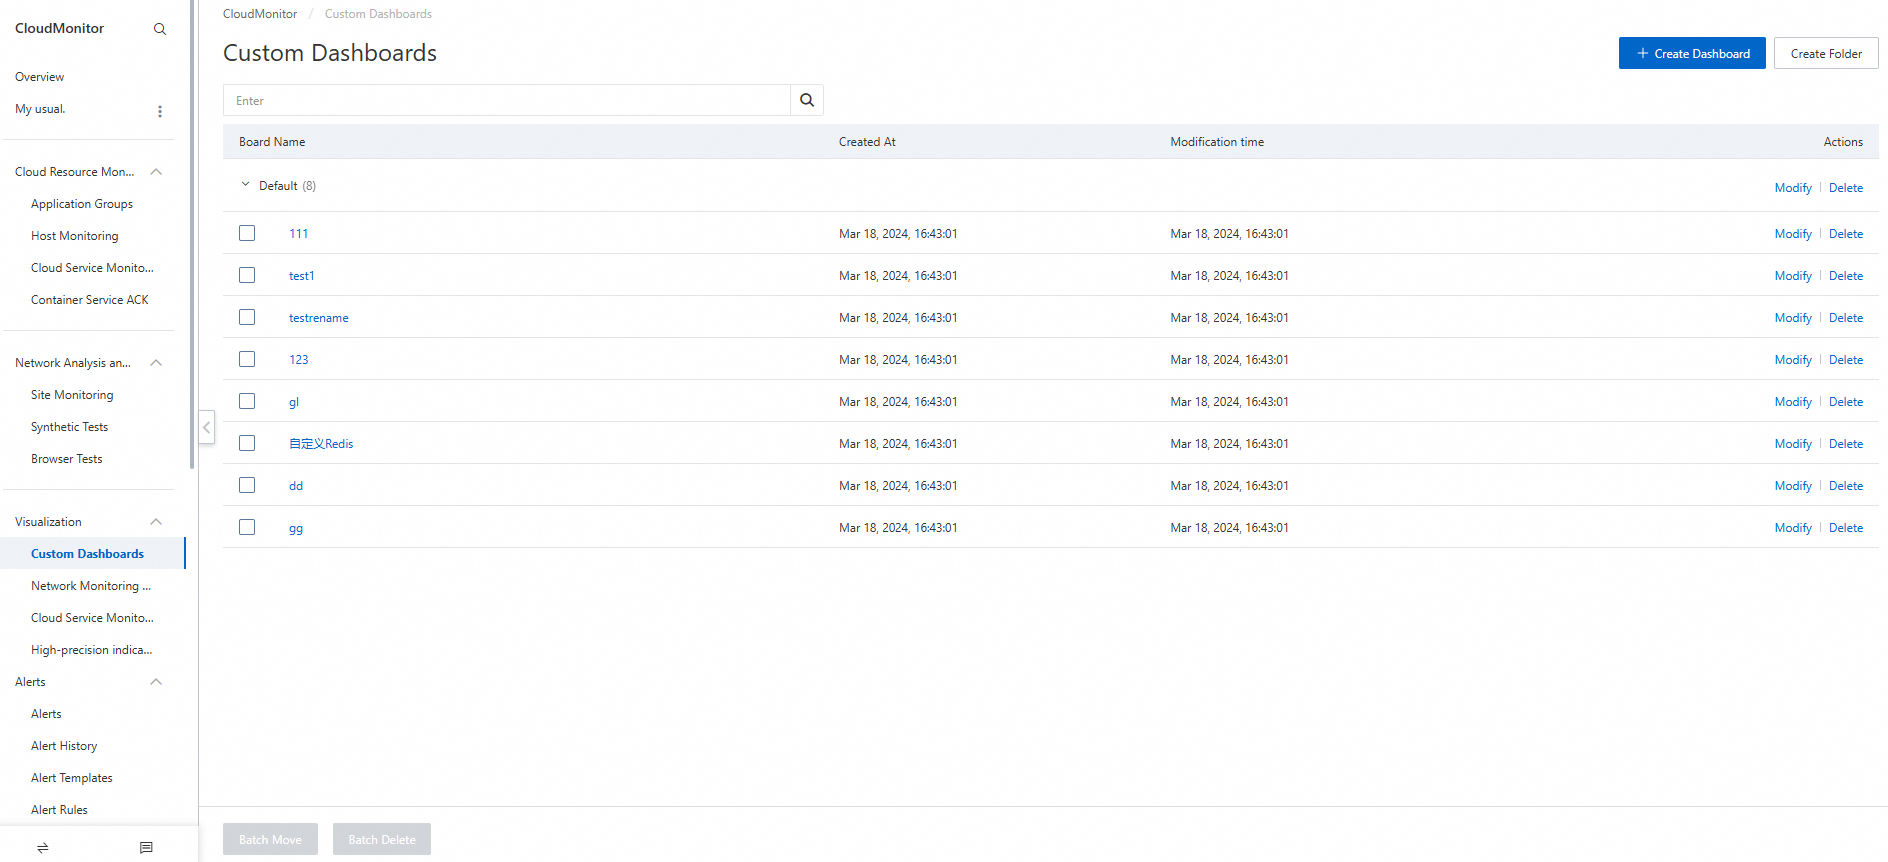
Create a dashboard
Click Create Dashboard and enter a custom name for the dashboard. If you have multiple instances under your account, create a separate dashboard for each instance.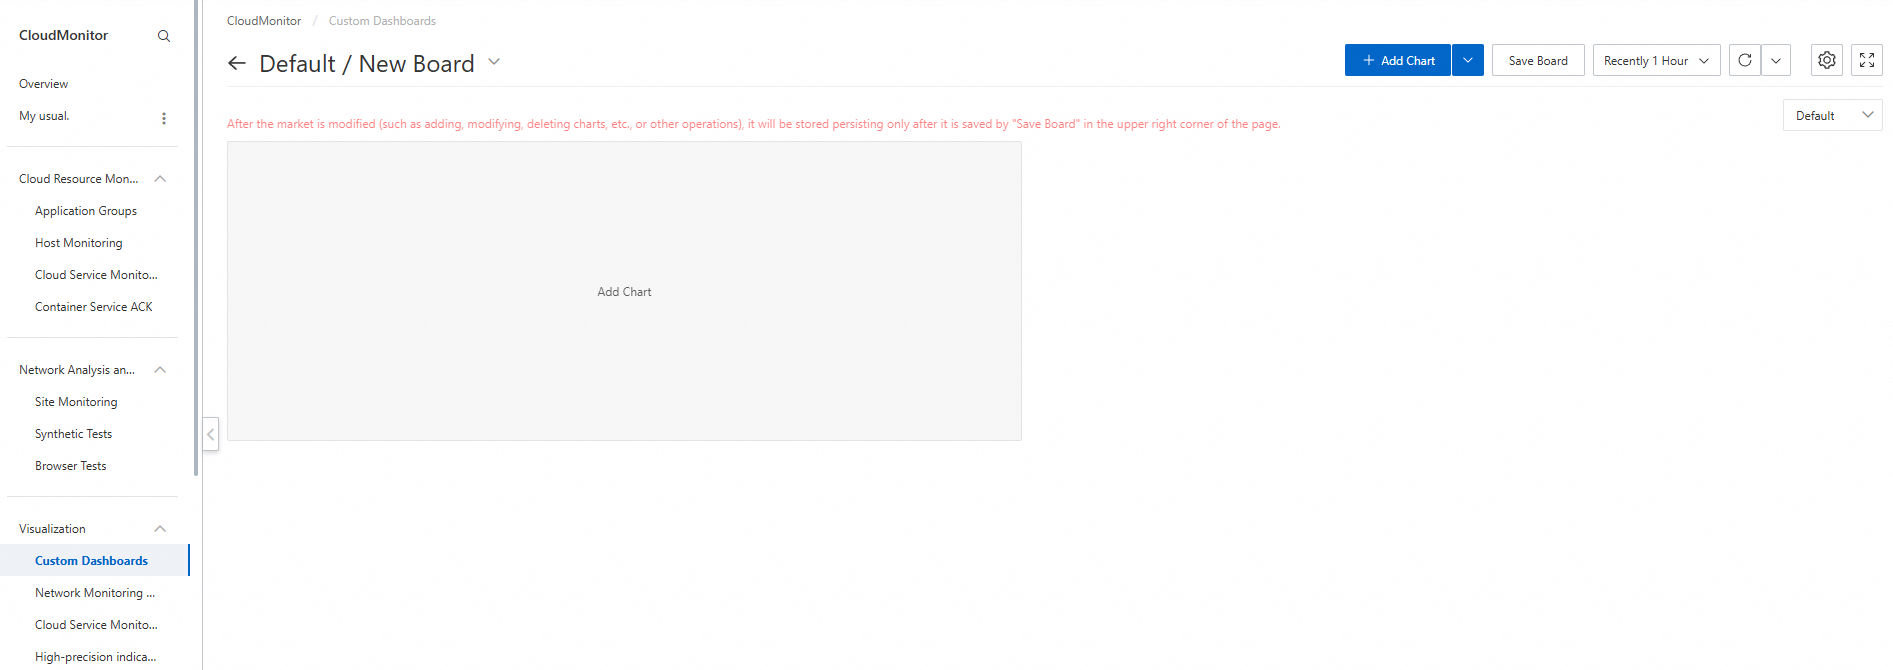
Add a metric chart
You can add charts for the metrics that you want to follow. We recommend adding a chart for each important metric. To add a chart, follow these steps:
-
Click Add Chart.
-
You can select the Artificial Intelligence Recommendation product.
-
Select the metric.
-
Enter a name for the chart. This name identifies the chart on the dashboard.
-
Select the instance.
-
Click Publish to add the chart to the dashboard.
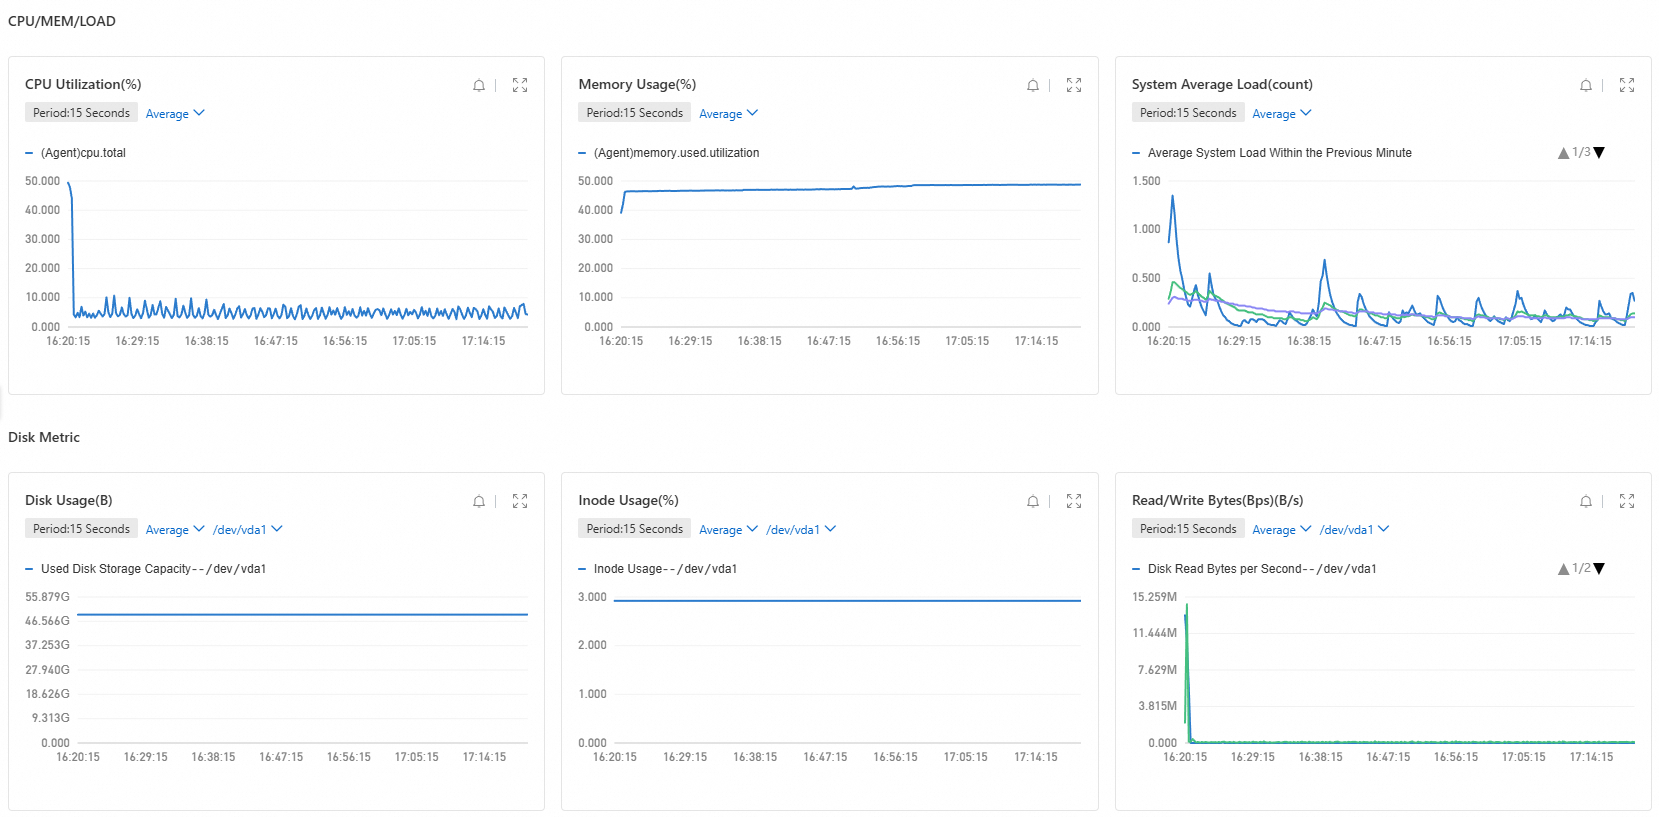
Adjust the dashboard layout
You can adjust the size and layout of each chart on the dashboard. We recommend the following arrangement.