In online O&M scenarios, you may need to monitor logs in real time and extract critical information from the latest logs for troubleshooting. Use LiveTail to monitor and filter logs in real time without the need to manage the corresponding servers.
Prerequisites
Logs are collected using Logtail. For more information, see Use Logtail to collect logs.
Background information
In online O&M scenarios, you may need to monitor logs in a queue in real time and extract critical information from the latest logs for troubleshooting. If you use a traditional O&M method, you must run the tail -f command on your server to query logs in log files. If you want to narrow the scope of the command output, you must run the grep or grep -v command to filter logs by keyword. To reduce O&M workloads, Simple Log Service offers LiveTail. Use it to monitor and analyze logs in real time.
Benefits
Monitor logs in real time and filter logs by keyword.
Configure indexes for collected logs based on collection configurations.
Use delimiters to split log fields into words. Query contextual logs that contain the words.
Locate a log file by log and monitor the logs in real time without the need to log on to a server.
Procedure
LiveTail is supported only for log data that is collected by Logtail.
Log on to the Simple Log Service console.
In the Projects section, click the one you want.

On the tab, click the logstore you want.

On the Raw Data tab, find the log that you want to manage, and click the
 icon.
icon.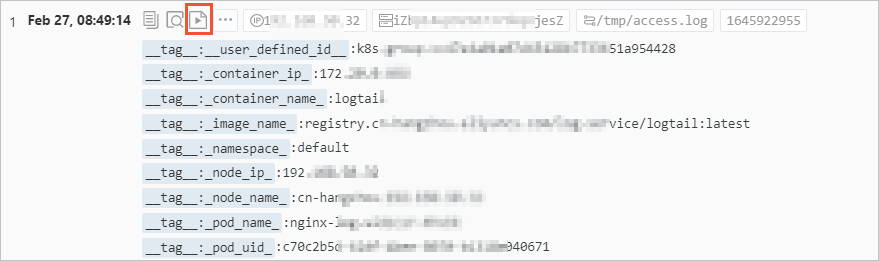
In the LiveTail area, view the results.After LiveTail is enabled, logs collected by Logtail are displayed in the LiveTail section in real time. By default, the latest log is displayed in the lower part of the LiveTail section. The scroll bar is also displayed in the lower part. Up to 1,000 logs can be displayed in the LiveTail section. If more than 1,000 logs are collected, the LiveTail section is automatically refreshed to display the latest 1,000 logs.
More operations
Operation | Description |
Highlight strings | Highlight specified strings in the LiveTail section. |
Filter logs by string | Only logs that contain the specified strings are displayed in the LiveTail section. |
Filter logs by field | Select one or more fields from the All Fields drop-down list. Logs that contain the specified fields are not displayed in the LiveTail section. |
Stop | After you stop LiveTail, logs in the LiveTail section are no longer updated. You can analyze and troubleshoot the errors that are identified when you monitor logs. |