Overview
HTTP or HTTPS health checks are performed to monitor multiple metrics of IP addresses over HTTP or HTTPS. These metrics include the web server network accessibility, service availability, and first packet latency. If a monitored IP address is abnormal, the system automatically blocks this IP address. If the IP address becomes normal, the system automatically unblocks the IP address.
Parameter description
Health Check Protocol
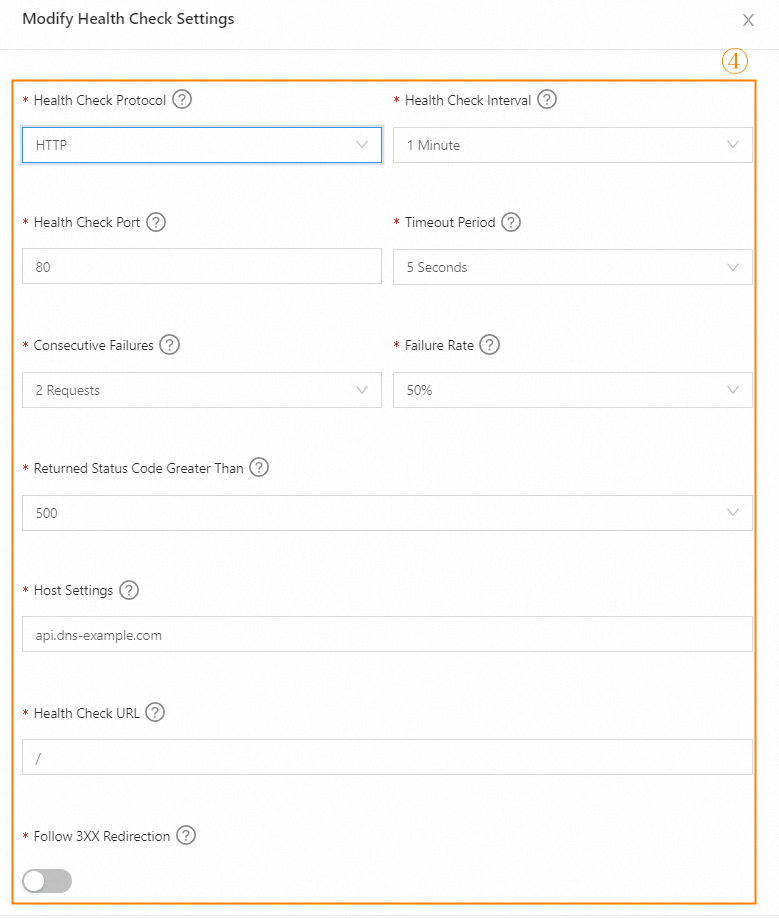
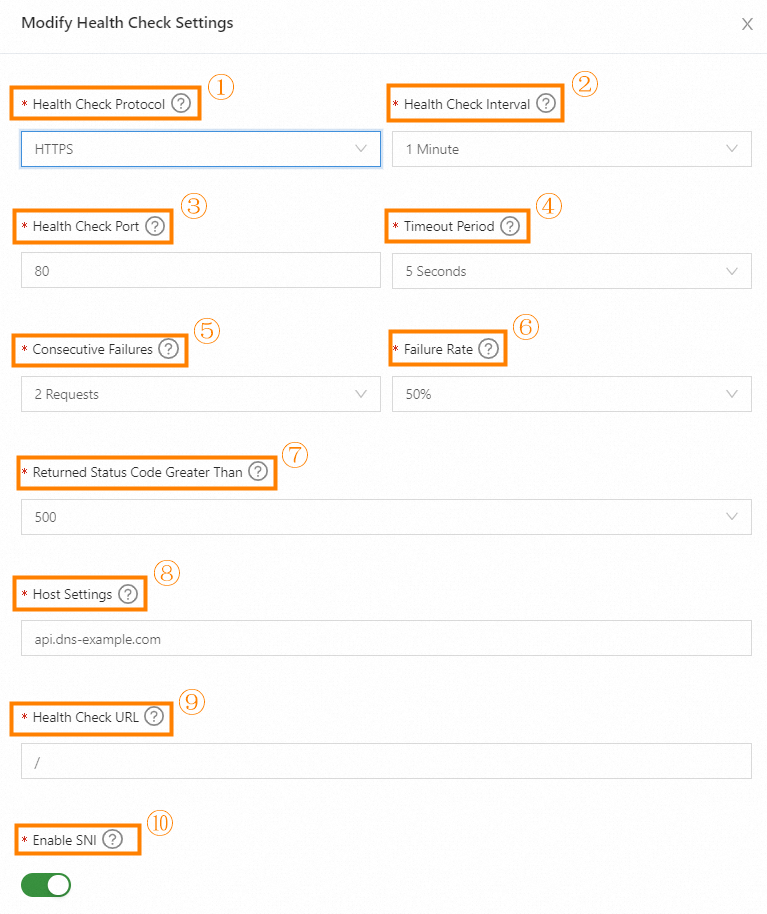
The protocol that is used to monitor the metrics of IP addresses. These metrics include the web server network accessibility, service availability, and first packet latency. In this example, HTTP or HTTPS is selected.
Health Check Interval
The interval between two consecutive HTTP or HTTPS health checks. Default value: 1 Minute.
Health Check Port
The port on which health checks are performed. The system monitors the IP addresses over HTTP or HTTPS and checks whether the specified port of the web server works as expected. The default port number for HTTP health checks is 80. The default port number for HTTPS health checks is 443. You can also specify a custom port number that you want to monitor.
Timeout Period
The timeout period of an HTTP or HTTPS health check. During an HTTP or HTTPS health check, the system calculates the response time of each HTTP or HTTPS packet that is sent. If the response time of a packet exceeds the specified timeout period, the health check times out. Valid values: 2 Seconds, 3 Seconds, 5 Seconds, and 10 Seconds.
Consecutive Failures
The number of consecutive health check failures for an IP address of an application service before the IP address is considered abnormal. An IP address of an application service is deemed abnormal only if it consecutively fails the health checks for the specified number of times. This prevents the accuracy of health checks from being affected by issues such as instantaneous network jitters. Valid values: 1 Request, 2 Requests, and 3 Requests.
1 Request: An application service is deemed abnormal when one health check determines that an IP address of the application service is abnormal. In this case, one alert is reported.
2 Requests: An application service is deemed abnormal when two health checks determine that an IP address of the application service is abnormal. In this case, two alerts are reported.
3 Requests: An application service is deemed abnormal when three health checks determine that an IP address of the application service is abnormal. In this case, three alerts are reported.
Failure Rate
The ratio of health check nodes that detect exceptions to all health check nodes during an HTTP or HTTPS health check. If the actual ratio exceeds the specified threshold, the application service is deemed abnormal. Valid values: 20%, 50%, 80%, and 100%.
Returned Status Code Greater Than
The alert threshold. During an HTTP or HTTPS health check, the system checks whether a web server works as expected based on the status code that is returned from the web server. If the returned status code is greater than the specified threshold, the corresponding application service is deemed abnormal.
400: indicates an invalid request. If an HTTP or HTTPS request contains invalid request parameters, a web server returns a status code that is greater than 400. In this case, you must specify an exact URL for the Health Check URL parameter.
500: indicates a server error. If some exceptions occur on a web server, the web server returns a status code that is greater than 500. This value is used by default.
Host Settings
The Host field of an HTTP or HTTPS request header during an HTTP or HTTPS health check. The specified value indicates the HTTP website that you want to visit. By default, the value is the domain name that you specify in the global settings.
Health Check URL
The URL path for HTTP or HTTPS health checks. Default value: /.
Enable SNI
Specifies whether to enable Server Name Indication (SNI). After SNI is enabled, the system sends a hostname to the monitored object during TLS negotiation.
Follow 3XX Redirection
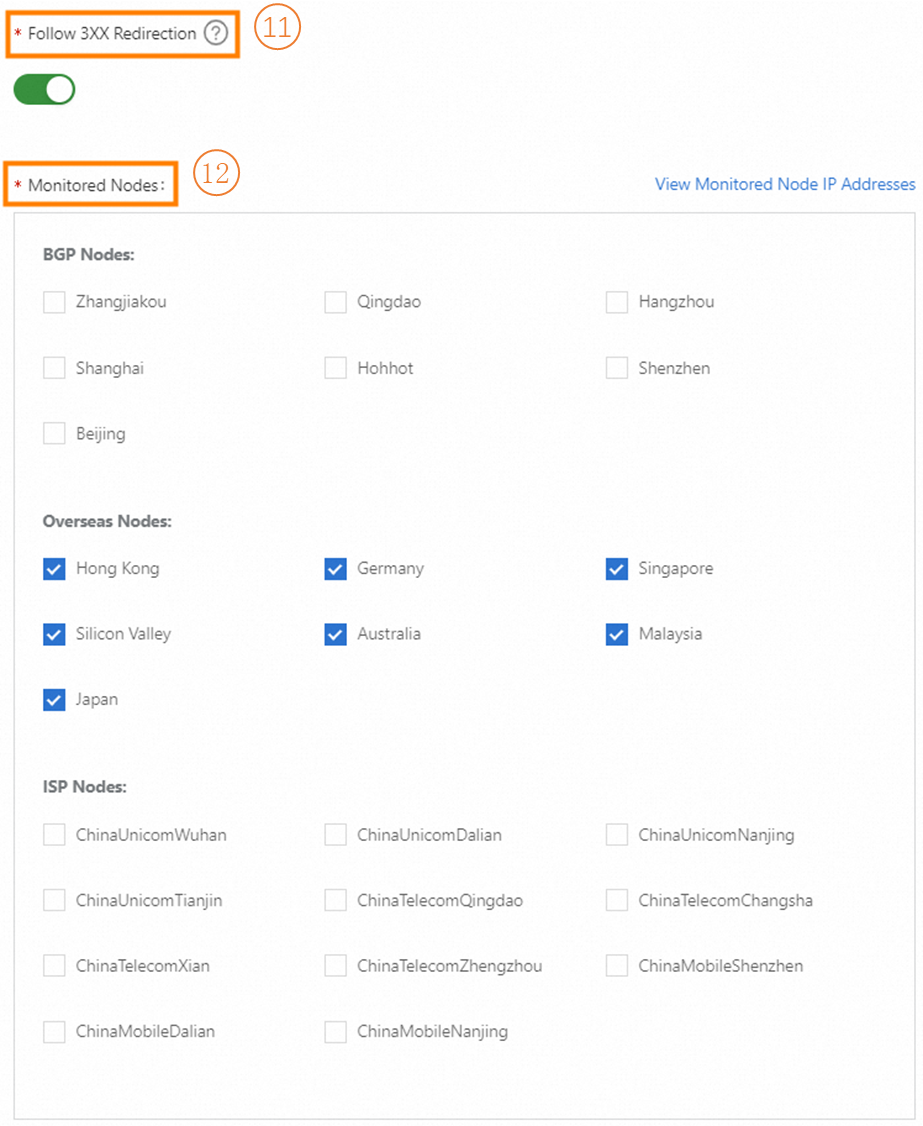
Specifies whether to enable Follow 3XX Redirection. If Follow 3XX Redirection is enabled, you are redirected to the destination address if an HTTP status code 3XX, such as 301, 302, 303, 307, or 308, is returned.
If Follow 3XX Redirection is disabled, you are not redirected to the destination address if an HTTP status code 3XX, such as 301, 302, 303, 307, or 308, is returned.
Monitored Nodes
The geographical location in which the nodes that perform HTTP or HTTPS health checks reside. The following table describes the default nodes that the system provides.
Node type
Geographical location
Border Gateway Protocol (BGP) nodes
Zhangjiakou, Qingdao, Hangzhou, Shanghai, Hohhot, Shenzhen, and Beijing
Nodes outside the Chinese mainland
Hong Kong, Germany, Singapore, Silicon Valley, Australia, Malaysia, and Japan
Internet service provider (ISP) nodes
China Unicom in Wuhan, China Unicom in Dalian, China Unicom in Nanjing, China Unicom in Tianjin, China Telecom in Qingdao, China Telecom in Changsha, China Telecom in Xi'an, China Telecom in Zhengzhou, China Mobile in Shenzhen, China Mobile in Dalian, and China Mobile in Nanjing
Procedure
Log on to the Alibaba Cloud DNS console.
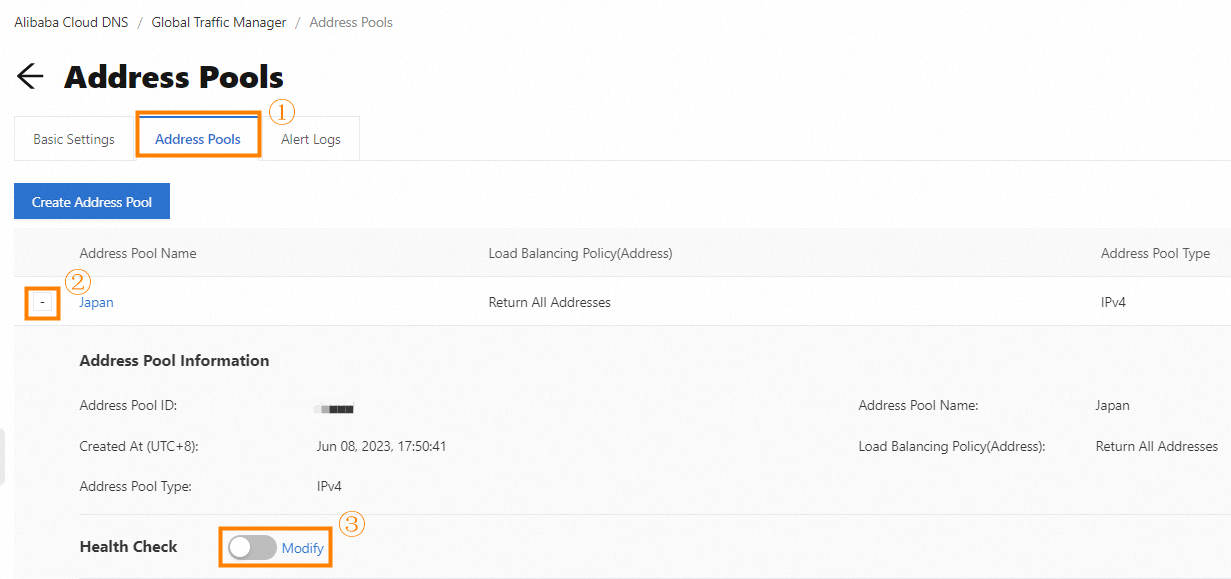
In the left-side navigation pane, click Global Traffic Manager. On the Global Traffic Manager page, find the Global Traffic Manager (GTM) instance that you want to manage, click its ID, and then perform the following operations:
If you have not configured the GTM instance, configure the instance by referring to the Enable the health check feature topic.
If the instance is configured, click the Address Pools tab. On this tab, turn on Health Check and click Modify. In the Modify Health Check Setting dialog box, modify the parameters based on the description of the parameters.