This topic provides answers to frequently asked questions about the Browser Monitoring sub-service of Application Real-Time Monitoring Service (ARMS).
Billing-related FAQ
Usage-related FAQ
Why do the names of some monitored pages or APIs contain asterisks (*)?
Why is the Source Map file error displayed when I am troubleshooting JavaScript (JS) errors?
What are the differences between console settings and the setConfig method?
What do I do if the ARMS configuration does not take effect?
Can JS errors returned by the console.error method be listened to?
In the Weex environment, why does a UID set for a mini program not take effect?
Why are the PVs on the same page different among modules in the ARMS console?
Why is the value of the duration parameter smaller than that of the connect download parameter?
Does ARMS Browser Monitoring support automatic capture of gRPC request errors?
What do I do if the ARMS console page does not open or appears blank?
Does ARMS Browser Monitoring (RUM) support filtering and querying data by custom fields?
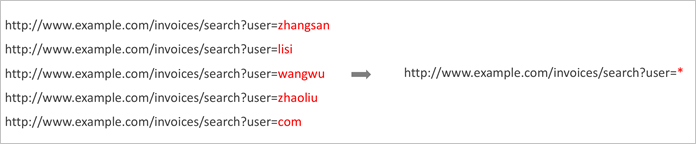
Why do some monitored URLs or APIs contain asterisks (*)?
The page statistics of Browser Monitoring are retrieved based on actual page URLs and calculated by dimension. The asterisks (*) in the names of monitored pages or APIs are not a part of the page URLs. The asterisks (*) indicate the result of URL convergence. Therefore, a name that contains an asterisk (*) is not a specific URL, but a group of similar URLs.
For example, in the ARMS console, go to the Page Satisfaction Ranking page under the Application group in the left-side navigation pane. This page shows the satisfaction count for each page URL. URLs that have undergone URL convergence will contain an asterisk (*).
How URL convergence works
Problem: Variables make it difficult to monitor or analyze similar URLs.
Objective: Group similar URLs by replacing variables with asterisks (*).
Solution: Use the proprietary URL convergence algorithm of Alibaba Cloud to group similar URLs and decrease the number of URLs. This way, you can keep as much semantic information as possible and decrease the number of URLs. This is completed in the following two steps:
Aggregation: Aggregate similar URLs into one group.
Variable identification: Extract the variables from the URLs in the same group, and replace the variables with asterisks (*).
Solution
For information about how to disable URL convergence, see urlHelper.
Why is the PV list different from the page speed list?
This is because your application is a single-page application (SPA), and the SPA auto-resolution feature is enabled. In SPA scenarios, page views (PVs) and the page speed are measured by using the following methods:
PVs: When a hashchange event is triggered, the PV data is automatically reported to record the PVs of the page based on the hash value. Therefore, when you view the PV list of an SPA, you can view the exact PVs of the hash pages.
Page speed: When the hash value of an SPA changes, the page speed does not change. Therefore, the page speed is not recorded based on the hash value. This way, unnecessary reports are avoided and page performance is clear.
No trace ID is found in the API logs, and as a result, the page fails to be redirected to the application monitoring page. Why does this happen?
Log on to the ARMS console.
-
In the navigation pane on the left, choose Frontend Monitoring > Browser Monitoring, and then click the name of the target application.
In the left-side navigation pane, choose .
On the Access Steps tab, check whether the Associate with Application Monitoring option is selected in your ARMS agent configuration. If not, select it and then reinstall the ARMS agent in your frontend application.
This option is in the SDK Extension Configuration section of the Advanced Settings tab.
Check whether the trace IDs are generated in the API logs. If no trace ID is generated, proceed to Step 5.
Check whether the domain name used in your page request is the same as the domain name used in your API request. If the domain name used in your page request is different from the domain name in your API request, this is cross-domain access. In this case, trace IDs fail to be generated to prevent API request failure caused by cross-domain authentication.
For information about how to resolve this problem, see Use the front-to-back tracing feature to diagnose API errors.
Why is the Source Map file error displayed when I am troubleshooting JavaScript (JS) errors?
Make sure that the file suffix is .js.map.
Make sure that your account has the permissions to write data to ARMS. If your account does not have the write permissions, contact your administrator.
What are the differences between console settings and the setConfig method?
Console settings can accelerate only the generation of configuration code, and the generated code takes effect only after the code is published. However, modifications made by calling the setConfig method immediately take effect.
The Application Settings page in the Browser Monitoring console provides several configuration switches, such as Enable FMP Collection for First Screen, Enable Page Resource Reporting, Associate with Application Monitoring, Enable User Behavior Replay, and Enable Console Tracking. The console automatically generates the corresponding agent code based on your selections and supports three integration methods: asynchronous loading, synchronous loading, and NPM package.
In addition, console settings are valid only when you initialize ARMS to monitor an application. When the application is being monitored by ARMS, you must call the setConfig method to modify configurations.
How do I configure the environment and version in an SDK?
You can set the release parameter to compare versions. For more information, see SDK reference. You can also set the environment parameter to distinguish different environments. For more information, see SDK reference.
The value prod indicates a production environment.
The value gray indicates a phased-release environment.
The value pre indicates a staging environment.
The value daily indicates a daily environment.
The value local indicates a local environment.
How do I view the version number of a configuration?
Log on to the ARMS console.
-
In the navigation pane on the left, choose Frontend Monitoring > Browser Monitoring, and then click the name of the target application.
In the left-side navigation pane, choose .
The version number for each log is displayed in the Version Number column of the Logs section. On the View Details page, you can view the Version Number column that corresponds to each log. If a version number is not configured, this column displays Not specified.
You can also filter logs by environment and version in the menu bar. You can use the version filter only after a version number is set for your PV logs.
How do I view the TP of a user for a page?
Log on to the ARMS console.
-
In the navigation pane on the left, choose Frontend Monitoring > Browser Monitoring, and then click the name of the target application.
-
In the navigation pane on the left, choose .
-
In the session list, click the Session ID of the target session to view the Session Tracking Details page.
Hover your pointer over the Timeline area in the Visit Timeline column to view the time on page (TP).
How do I view the custom performance metrics for Browser Monitoring?
Log on to the ARMS console.
-
In the navigation pane on the left, choose Frontend Monitoring > Browser Monitoring, and then click the name of the target application.
In the left-side navigation pane, choose .
Custom performance metrics are displayed in the Page Speed section.
What do I do if the ARMS configuration does not take effect?
The possible reason is that the browser cache is not updated. To resolve this issue, perform the following operations: In the left-side navigation pane of the ARMS console, choose Application > View Details. Switch to the latest version to view the trend chart. If the version number is not configured, you can set the release parameter of the ARMS SDK. For more information, see SDK reference. After the release parameter is set, check whether the value that you specified is displayed as the latest version.
If the console shows no monitoring data at all after the SDK is integrated, check whether the ARMS RUM SDK initialization script is placed inside the <body> tag of your HTML file. If the script is placed in the <head> tag or another location, data may fail to be reported. Adjust the script position and redeploy to verify.
Why are JS errors on mini programs not reported?
This may be because error messages are captured by the trycatch statement at the underlying layer of the mini programs in asynchronous mode, and the error messages fail to be uploaded. You can manually report error messages. For more information, see API reference.
Can JS errors returned by the console.error method be listened to?
Yes, JS errors returned by the console.error method can be listened to. Web browsers report the error messages that meet the format requirements of JS errors.
You can manually report error messages in the mini program. For more information, see API reference.
In the Weex environment, why does a UID set for a mini program not take effect?
If you have not called the setConfig method, check whether you specified a UID during initialization configuration. If you did not specify a UID, specify one.
If you have called the setConfig method, specify another UID and call the method again.
How long can logs be stored?
ARMS Basic Edition: Logs can be stored for up to seven days.
ARMS Pro Edition: Logs can be stored for up to 30 days.
After I activate ARMS Pro Edition, can I continue to use the sites that are created during the trial period?
No, you cannot continue to use those sites. Within 15 days after the trial period expires, the sites are suspended due to overdue payments. You can try to restart the application.
If ARMS Pro Edition is not activated within 15 days after the trial period expires, the sites are deleted to save your computing and storage resources. Relevant resources are released, and the data on the resources cannot be recovered.
What version numbers are used by the application edition and host edition of ARMS?
The application edition uses the version number of the current online project. You can set the release parameter of the ARMS SDK to specify the version number of the application edition. For more information, see SDK reference.
The host edition uses the version number of the app where the current project resides. The version number of the host edition is automatically obtained by the SDK. The version of a hosted app cannot be resolved. Only versions of Taobao, Alipay, or WeChat are resolved.
Why are the PVs on the same page different among modules in the ARMS console?
On the Page Speed page, the number of PVs is equal to the number of entries in the performance log multiplied by the sampling rate.
On the Page page under Dimensions, the number of PVs is equal to the value shown in the PV log.
Performance logs to be automatically reported are reported only after pages are loaded. A performance log is reported each time the page is refreshed.
After the SPA mode is enabled, PV logs are reported each time routes are switched. In SPA mode, the number of performance logs is smaller than the number of PV logs. This results in a large difference in the PVs for different modules.
Why is the value of the duration parameter smaller than that of the connect download parameter?
ARMS resource loading performance data is obtained from performance.getEntriesByType('resource'). By default, when there are cross-origin restrictions on accessing page resource timing details, the values obtained from performance.getEntriesByType('resource') for the following fields in the performance data of cross-origin resources are 0.
redirectStart
redirectEnd
domainLookupStart
domainLookupEnd
connectStart
connectEnd
secureConnectionStart
requestStart
responseStart
This can cause some time properties to be inaccurate. For example, in the calculation connect download: responseEnd - responseStart, because the responseStart timestamp is 0, the connect download value becomes larger than the duration.
To resolve this issue, for self-managed CDN resources, you can configure the response header Timing-Allow-Origin to specify the time allowed to obtain the resources.
For third-party resources, we recommend that you use the value of the duration parameter as the major reference.
What do I do if I am not sure whether the SDK has been loaded when I call the __bl.performance() method?
For more information, see Page data reporting of SPAs.
Does ARMS Browser Monitoring support automatic capture of gRPC request errors?
ARMS Browser Monitoring does not support automatic capture of gRPC request error logs that are sent through a client-side Bridge. This is because gRPC is a non-standard HTTP request protocol that relies on native capabilities and falls outside the automatic data collection scope of the Browser Monitoring SDK.
What do I do if the ARMS console page does not open or appears blank?
If an ARMS console page (such as a dashboard or an analysis page) does not open or appears blank, perform the following checks:
Browser cache or configuration issues: Try accessing the console in an incognito (private browsing) window to rule out browser cache or extension interference.
Permission or activation status issues: Visit the Application Monitoring activation page to check whether there are any prompts about missing permissions or service activation.
Troubleshooting with developer tools: Open your browser developer tools by pressing F12. Check the Console tab for JavaScript errors and the Network tab for failed requests, and use the error information to locate the root cause.
Does ARMS Browser Monitoring (RUM) support filtering and querying data by custom fields (such as status_code or userId)?
By default, ARMS Browser Monitoring does not support directly filtering and querying data by custom business fields such as status_code or userId. If you have this requirement, consider the following alternatives:
Integrate ARMS Application Monitoring (APM) and use the Extract Business Parameters feature to enable custom field queries for backend request parameters such as status codes and user IDs.
Export your business data to Log Service (SLS) and use the SLS log query system for flexible querying and analysis.