The quick analysis feature of Simple Log Service allows you to perform a query with ease. You can use this feature to analyze the distribution of a field over a period of time.
Prerequisites
Indexes are configured for the required fields and Enable Analytics is turned on for the fields. For more information, see Create indexes.
For example, if a log contains the request_method and request_time fields, you can configure indexes for the two fields. The following figure shows the configurations.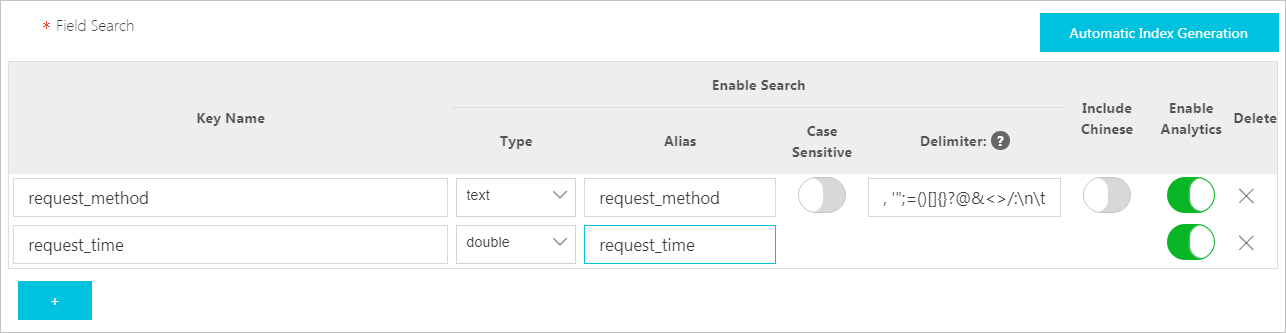
Features
Allows you to analyze the first 100,000 logs that are returned for a query.
NoteWhen you perform a quick analysis during the selected time range, the first 100,000 logs are returned. If you use a saved search to query all data in a Logstore, you must delete the Limit 100000 clause.
Groups fields of the text type and provides statistics about the top 10 groups.
Generates approx_distinct statements for fields of the text type.
Supports histogram-based statistics about the approximate distribution of fields of the long and double type.
Histogram-based statistics groups sampling data and calculates the average value of each group.
Searches for the maximum, minimum, average, or sum of fields of the long and double type.
Generates a query statement based on a quick analysis.
Procedure
Log on to the Simple Log Service console.
In the Projects section, click the project that you want to manage.

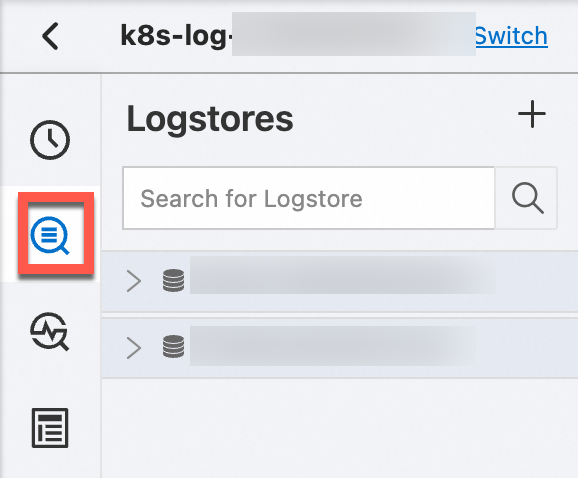
In the left-side navigation pane, click Log Storage. In the Logstores list, click the Logstore that you want to manage.
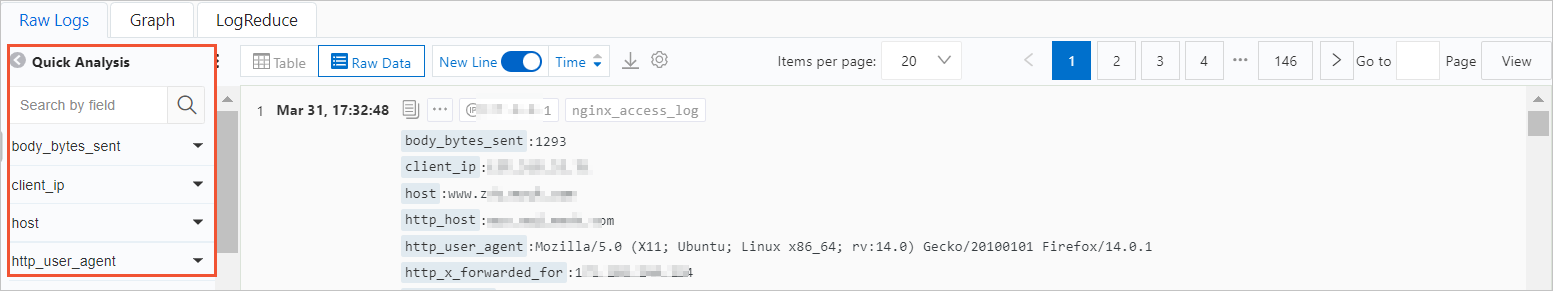
On the Raw Logs tab, click the required field in the Quick Analysis column.
Provide grouping statistics for fields of the text type and approximate distribution histogram-based statistics for fields of the long and double type. For more information, see Text type or Long and double types.
Provide query statements.
Click the
 icon next to the required field. You are redirected to the Graph tab. A query statement for grouping statistics is provided in the search box.
 Calculate the number of distinct values of a field.
In the Quick Analysis column, click Count Distinct Values under the required field. You can obtain the number of distinct values of the
${keyName}field.Display field names or aliases.
Click the
 icon to specify whether to display field names or aliases. Aliases can be specified when you configure indexes. For example, if you set the alias of host_name to host, host is displayed in the Quick Analysis column after you select Show Field Aliases. Note
If you do not specify an alias for a field, the field name is displayed after you select Show Field Aliases.
Text type
The quick analysis feature provides grouping statistics for fields of the text type. If you use this method, the first 100,000 logs are grouped and the ratios of the top 10 groups are returned. For example, you can obtain the following result based on grouping statistics of request_method. The GET method is the most common request method.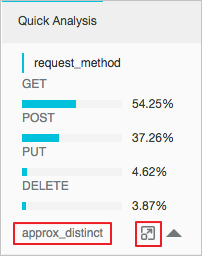
Long and double types
Display approximate distribution by using histograms.
The number of field values of the long and double types is large. The preceding grouping analytics method is not suitable for the long or double type. Simple Log Service assigns field values into 10 buckets and displays the approximate distribution of the values in a histogram. The following figure shows the approximate distribution of the request_time field. This distribution of field value indicates that most of the request periods are distributed around 1.346 milliseconds.
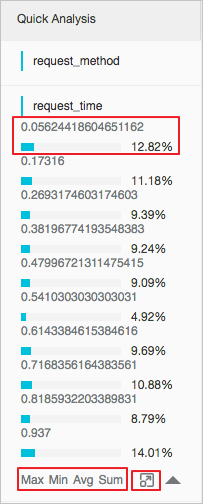
Quick analysis on the maximum value, minimum value, average, and sum of fields.
You can click Max under a field to search for the maximum value, Min to search for the minimum value, Avg to calculate the average value, and Sum to calculate the sum of fields.