Application Real-Time Monitoring Service (ARMS) provides Application Monitoring, a feature built on EagleEye, Alibaba's distributed tracing and monitoring system. It helps website developers and operators pinpoint failures, identify bottlenecks, and map service dependencies across distributed Java applications -- without modifying your code.
Monitoring challenges in microservice architectures
As organizations adopt microservice architectures built on frameworks like Spring Cloud and Dubbo, three monitoring challenges emerge:
Pinpointing failures across services -- A single request passes through multiple services and nodes. When an error occurs, O&M engineers must correlate logs across multiple servers. Multiple teams often collaborate to troubleshoot a single issue.
Identifying performance bottlenecks -- When a service becomes unresponsive, the root cause could be network issue between the user terminal and the server, server overload, or database overload. Even after isolating the layer, tracing the problem to specific code remains difficult.
Understanding service dependencies -- Downstream services (databases, HTTP APIs, or caches) and upstream callers are hard to identify from code alone. This lack of visibility complicates business logic analysis, architecture governance, and capacity planning. When Alibaba implemented its microservice architecture on Taobao (www.taobao.com), predicting the server count each application required for Double 11 promotion campaigns was a significant challenge.
ARMS Application Monitoring capabilities
ARMS Application Monitoring addresses these challenges through three capabilities: call topology visualization, slow service and SQL analysis, and distributed tracing.
Call topology
Visualize the complete dependency graph of an application: upstream services that send requests to it, and downstream services it calls. The call topology makes service relationships immediately visible, eliminating the need to trace dependencies through code.
Slow service and slow SQL analysis
Surface performance bottlenecks through the SQL analysis report, which lists slow SQL statements and slow services in a single view.
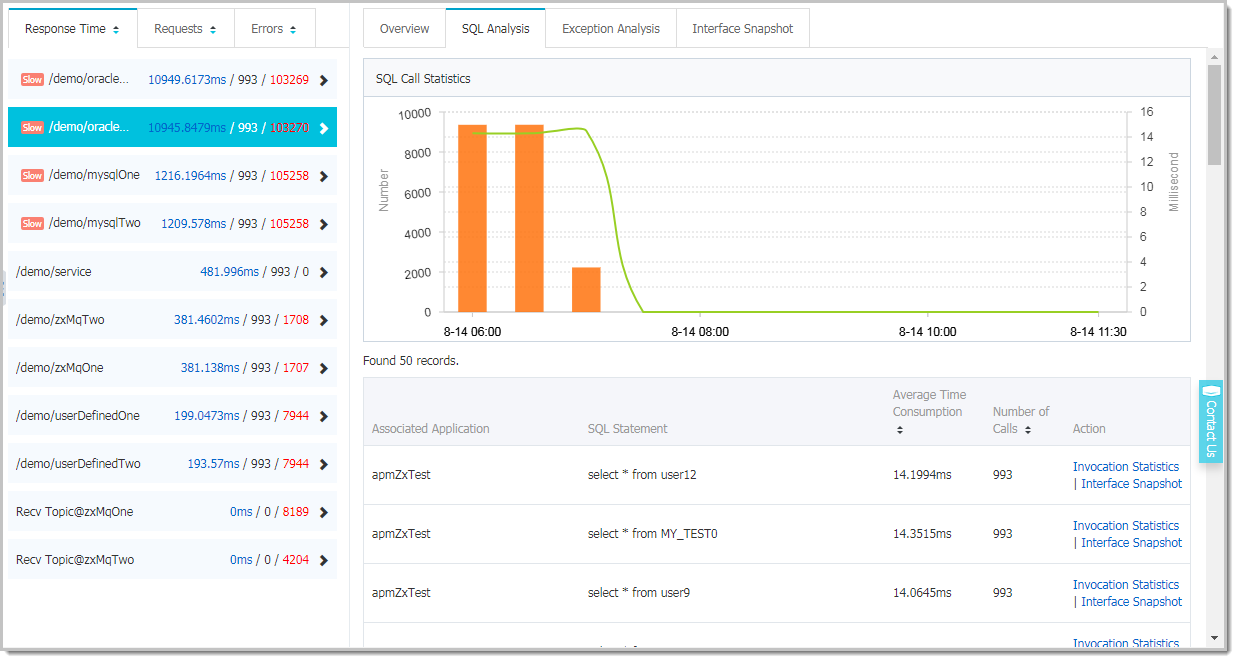
The report ranks queries by response time, making the database calls that degrade performance immediately apparent.
Distributed tracing
Trace any request end-to-end across the entire service chain. From the SQL analysis report, click an interface snapshot of a slow SQL statement to locate the request that triggered the call. Then inspect the full call stack to identify the exact method responsible.
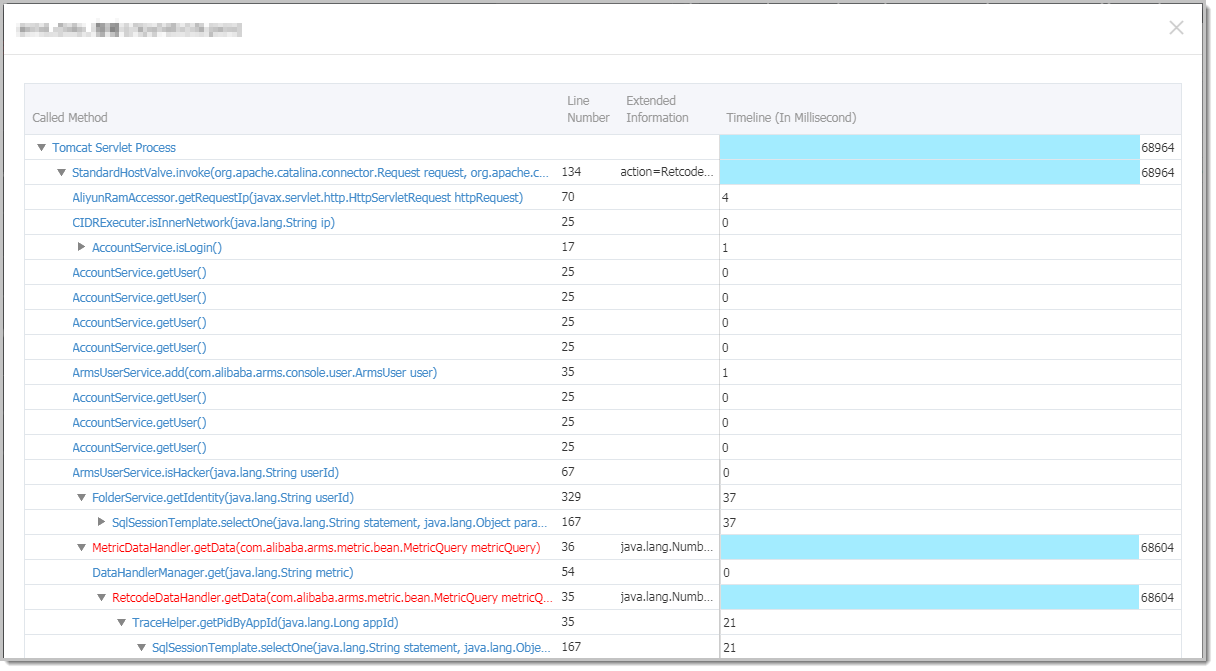
The trace view displays the complete call chain from the initial request through each downstream service, with timing data at every level. This makes it straightforward to identify where latency originates -- whether in a specific RPC call, a database query, or an external HTTP request.
End-to-end monitoring with Browser Monitoring
Combine Application Monitoring with Browser Monitoring to cover the full stack: from critical business metrics and end-user experience to backend application performance. This integration provides all-around protection for your sites, with visibility into both frontend experience and backend health.
Next steps
[Set up Application Monitoring for your Java application]
[Explore the call topology for your services]