Simple Log Service allows developers to search large volumes of logs by keyword. You can also view the context of a specific log within its raw file directly in the Simple Log Service console, without having to log on to a server.
Prerequisites
Logs are collected using Logtail. For more information, see Use Logtail to collect logs.
Indexes are created. For more information, see Create indexes.
Background information
When you use the contextual query feature, you must specify a server, a log file, and the log whose context you want to query. The feature returns logs that were generated before and after the specified log from the same log file on the server. You can use this context information to efficiently identify and troubleshoot errors.
Scenarios
For example, a transaction on an online-to-offline (O2O) takeout app is recorded in an application log file on a server. A successful transaction involves the following operations: user logon, product browsing, product selection, product addition to the shopping cart, order placement, order payment, payment deduction, and order generation.
If an order fails, Operations and Maintenance (O&M) engineers must identify the cause of the failure as soon as possible. In traditional contextual query solutions, O&M engineers must be granted the required permissions by an administrator before they can log on to each server on which the O2O takeout app is deployed. After the permissions are granted, the O&M engineers can search application log files by order ID to identify the cause of the failure.
In Simple Log Service, the O&M engineers can perform the following steps to identify the cause of the failure:
Install Logtail on each server, create a machine group and a Logtail configuration in the Simple Log Service console, and then enable Logtail to upload incremental logs to Simple Log Service.
On the query and analysis page in the Simple Log Service console, specify a time range and find the log that records the failure by order ID.
After you find the log, scroll up to find other related logs, such as a log that records a failure in payment deduction from a credit card.

Benefits
You can identify the causes of failures without having to modify applications or change the formats of log files.
You can query the context of a log from a log file on a server directly in the Simple Log Service console, without having to log on to the related server.
You can specify a time range to retrieve suspicious logs before you perform a contextual query in the Simple Log Service console. This helps improve troubleshooting efficiency.
You do not need to worry about data loss caused by insufficient server storage or log file rotation. You can view historical log data in the Simple Log Service console at any time.
Procedure
Simple Log Service uses a PackId to associate a log with its context. A PackId can be automatically generated by Logtail when it collects logs or by a Producer software development kit (SDK) when it writes logs. You can also manually generate a PackId and upload it by calling the PutLogs operation. For more information, see Associate a log with its context using a PackId.
Log on to the Simple Log Service console.
In the Projects section, click the one you want.

On the tab, click the logstore you want.

Optional: Enter a search statement and select a time range.
On the tab, find the target log and click the
 icon.
icon.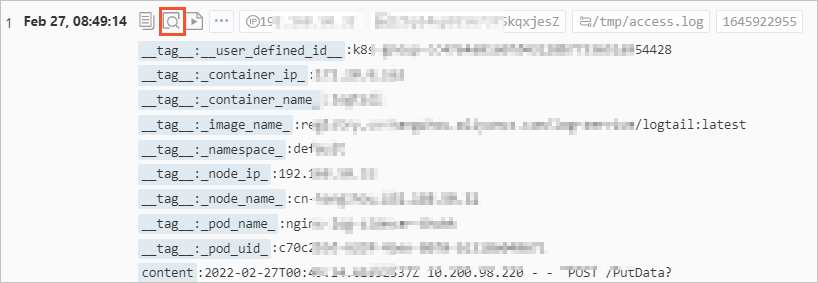
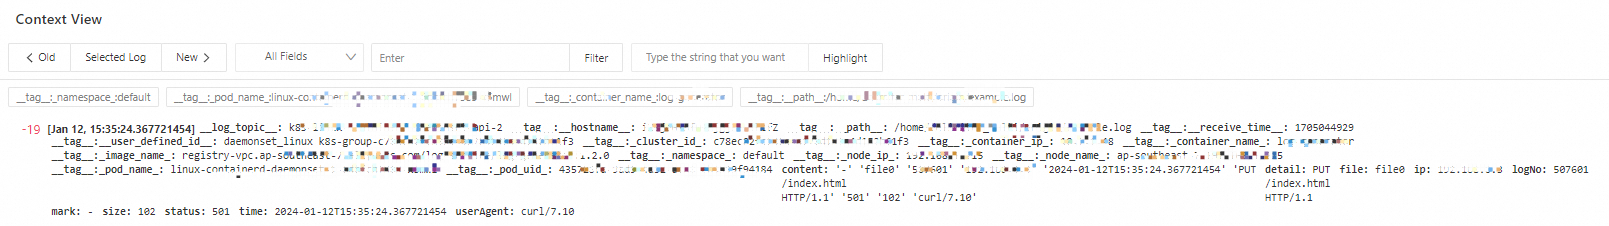
Scroll up or down on the page to view the context of the specified log.
Click Old to scroll to earlier content.
Click New to scroll down.
Click All Fields to show the list of field names. By default, all fields are displayed. Click a field name to toggle its visibility.
In the Filter text box, enter a filter string. The log list then displays only the logs that contain the specified string.
To highlight a string in yellow, enter it in the Highlight text box.