This topic will walk you through creating a Grafana workspace, and migrating Shared Edition dashboards and self-managed dashboards to the workspace.
Create a workspace
Log on to the ARMS console. In the left-side navigation pane, choose .
On the Overview page, click Create Workspace.
On the buy page, configure the following parameters and click Create Now.
Parameter
Description
Workspace Name
Enter a name for the Grafana workspace.
Admin Password
Set the admin password.
Region
Select the region where the workspace resides.
Version
The edition of Managed Service for Grafana. For information about the billing of each edition of Managed Service for Grafana, see Billing rules.
Grafana Version
Select the version of Managed Service for Grafana.
Number of Accounts
Select the number of accounts. For information about the billing of each edition of Managed Service for Grafana, see Billing rules.
Duration
Select a subscription duration.
Auto-renewal
If you enable auto-renewal, billing automatically starts after the trial use expires. For information about the billing of each edition of Managed Service for Grafana, see Billing rules.
Resource Group
The resource group used to manage resources of your Alibaba Cloud account. Then, you can centrally manage permissions, deploy resources, or monitor resources.
Tag
Specify the Tag Key and Tag Value fields to facilitate workspace management.
After you complete the payment, you can view the created workspace and its expiration date on the Workspace Management page.
(Optional) Migrate dashboards
Migrate Shared Edition dashboards
The Shared Edition provides the following dashboards:
Application Monitoring dashboard: You have read-only access to the dashboard. For information about the dashboard metrics, see Application monitoring metrics.
Default Prometheus dashboard: You have read-only access to the dashboard. For information about the dashboard metrics, see Metrics.
Alert Management dashboard: You have read-only access to the dashboard.
Synthetic Monitoring dashboard: You have read-only access to the dashboard.
On the Overview page, click Migrate Shared Edition. In the dialog box that appears, select the workspace to which you want to migrate dashboards, click Next, and then click OK.
Once the migration is complete, you can view all dashboards on the Dashboards page in the Grafana system.
Migrate self-managed Grafana dashboards
On the Overview page, click Migrate Self-managed Grafana. In the dialog box that appears, select the workspace to which you want to migrate dashboards and click Migrate Now.
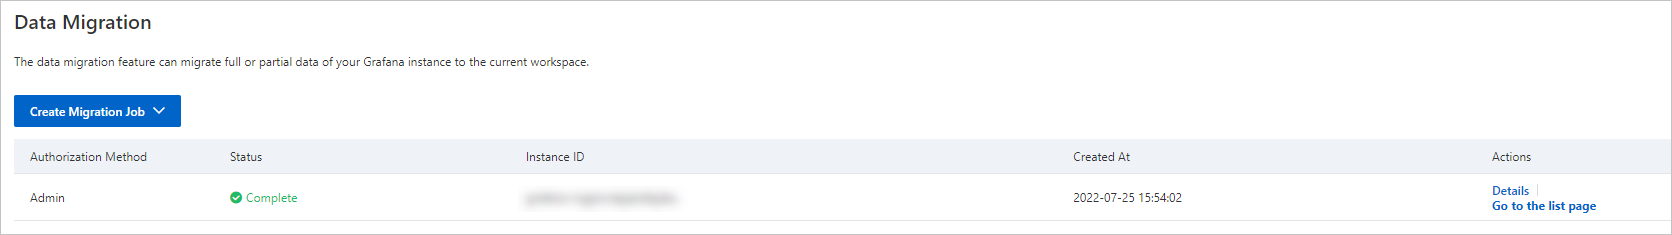
On the Data Migration page, click Create Migration Job, and select Migrate Self-managed Grafana.
In the Create Migration Job dialog box, set the Authorization Method parameter to Admin, enter the Grafana endpoint and administrator password, and then click Next.
Specify the migration method for each organization, and then click Start Migration.
Do not migrate the organization: Data sources and dashboards in the organization are not migrated.
Create an organization with the same name: Data sources and dashboards in the organization are migrated to a new organization with the same name.
An organization in the current workspace: Data sources and dashboards in the organization are migrated to a specific organization.
After the migration is complete, click Go to the list page to visit the Dashboards page in the Grafana system and view all dashboards.
(Optional) Data source integration of Alibaba Cloud services
Managed Service for Grafana supports the integration of data sources of various Alibaba Cloud services, such as Managed Service for Prometheus, Simple Log Service, CloudMonitor, the Application Monitoring sub-service of Application Real-Time Monitoring Service, Lindorm, and Elasticsearch, to help you generate comprehensive O&M visualization dashboards. For more information, see Integrate cloud services.