PolarProxy Enterprise Edition allows you to monitor a variety of performance metrics and view monitoring data at intervals of seconds. You can monitor the status of your clusters and locate faults based on fine-grained monitoring data. You can also create alert rules for PolarProxy to notify you of monitoring data exceptions for PolarProxy in a timely manner and troubleshoot such exceptions.
Note
For clusters that were purchased before December 9, 2021, you must upgrade PolarProxy to PolarProxy Enterprise Edition to use the performance monitoring feature. For clusters that were purchased after December 9, 2021, the performance monitoring feature can be used directly.
During the upgrade, new sessions are established to the new PolarProxy. Sessions established to the original PolarProxy are automatically closed 24 hours after the upgrade starts. We recommend that you perform this upgrade operation during off-peak hours and make sure that your applications can automatically reconnect to the database service.
View performance monitoring data
Enter the monitoring page of PolarProxy.
Log on to the PolarDB console.
In the left-side navigation pane, click Clusters.
In the upper-left corner, select the region in which the cluster that you want to manage is deployed.
Find the cluster and click its ID.
In the left-side navigation pane, choose .
On the Performance Monitoring page, click PolarProxy.
(Optional) Upgrade PolarProxy.
NoteFor clusters that were purchased before December 9, 2021, perform the following steps to upgrade PolarProxy. For clusters that were purchased after December 9, 2021, ignore this operation.
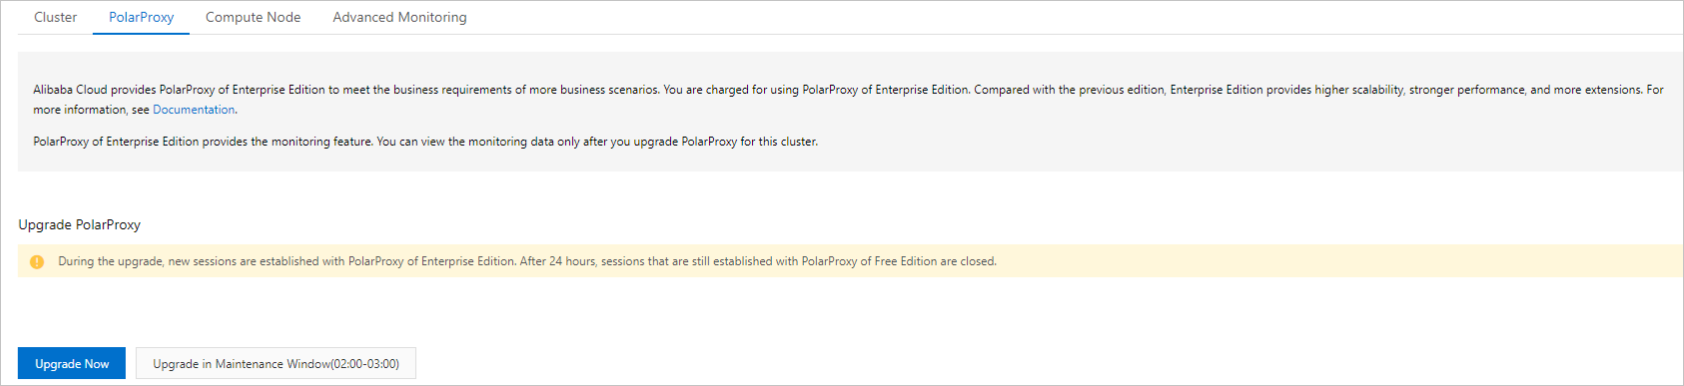
On the PolarProxy tab, click Upgrade Now or Upgrade in Maintenance Window.
If you select Upgrade in Maintenance Window, you can view the details of the task or cancel the task on the Scheduled Tasks page. For more information, see Scheduled tasks.
In the message that appears, click OK.
View the monitoring data of the PolarProxy performance metrics.
On the PolarProxy tab, you can view the PolarProxy monitoring data based on your business requirements.
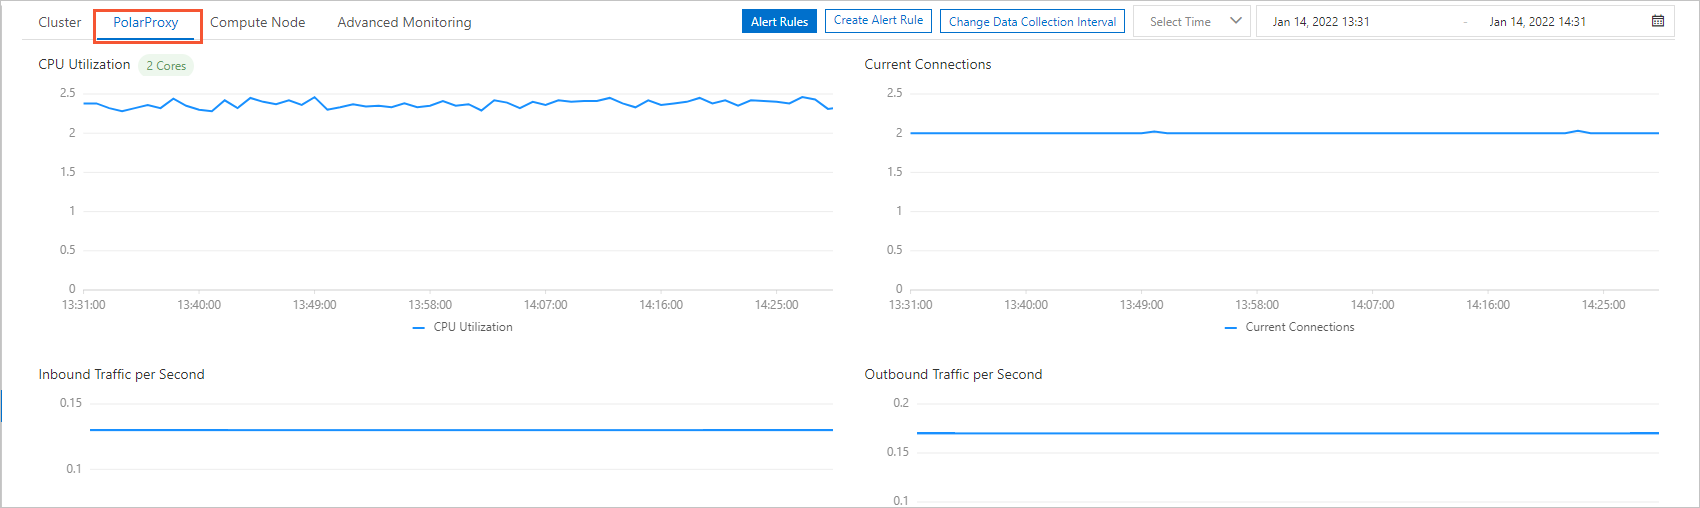
CPU Utilization indicates the usage of vCPUs of the cluster nodes occupied by PolarProxy. You can calculate the number of vCPUs that are occupied by PolarProxy in the following way: For Standard Enterprise Edition, it is rounded up from one sixth of the total vCPUs of the cluster nodes. For Dedicated Enterprise Edition, it is rounded up from one fourth of the total vCPUs of the cluster nodes.
For example, a Dedicated Enterprise Edition cluster has two nodes, and each node has four vCPUs. In this case, PolarProxy occupies two vCPUs.
Create an alert rule
For more information about how to create an alert rule, see Create an alert rule.