The log analysis feature allows you to use logs to accurately identify service exceptions that occur in your application. The log analysis feature allows you to analyze the logs that are collected by Simple Log Service or Application Real-Time Monitoring Service (ARMS). This topic describes how to enable the log analysis feature and analyze the logs collected by Simple Log Service.
Prerequisites
Your application is monitored by ARMS. For more information, see Application Monitoring overview.
Simple Log Service is activated. Log on to the Simple Log Service console and activate Simple Log Service by following the on-screen instructions.
A Simple Log Service project is created. For more information, see Create a project.
A Logstore is created. For more information, see the Create a Logstore section of the Manage a Logstore topic.
Trace data is collected and imported to Simple Log Service. For more information, see Data collection overview.
Step 1: Associate business logs with trace IDs
Log on to the ARMS console. In the left-side navigation pane, choose .
On the Application List page, select a region in the top navigation bar and click the name of the application that you want to manage.
NoteIf the
 icon is displayed in the Language column, the application is connected to Application Monitoring. If a hyphen (-) is displayed, the application is connected to Managed Service for OpenTelemetry.
 In the left-side navigation pane, click Application Settings. On the page that appears, click the Custom Configuration tab.
In the Log Collect Configuration section of the Custom Configuration tab, turn on the Link Business Logs with TraceId switch, select the region where the Simple Log Service project resides, and then associate the project with the Logstore.
In the lower-left corner of the Custom Configuration tab, click Save.
Step 2: Query and analyze logs
Log on to the ARMS console. In the left-side navigation pane, choose .
On the Application List page, select a region in the top navigation bar and click the name of the application that you want to manage.
NoteIf the
icon is displayed in the Language column, the application is connected to Application Monitoring. If a hyphen (-) is displayed, the application is connected to Managed Service for OpenTelemetry. In the left-side navigation pane, choose .
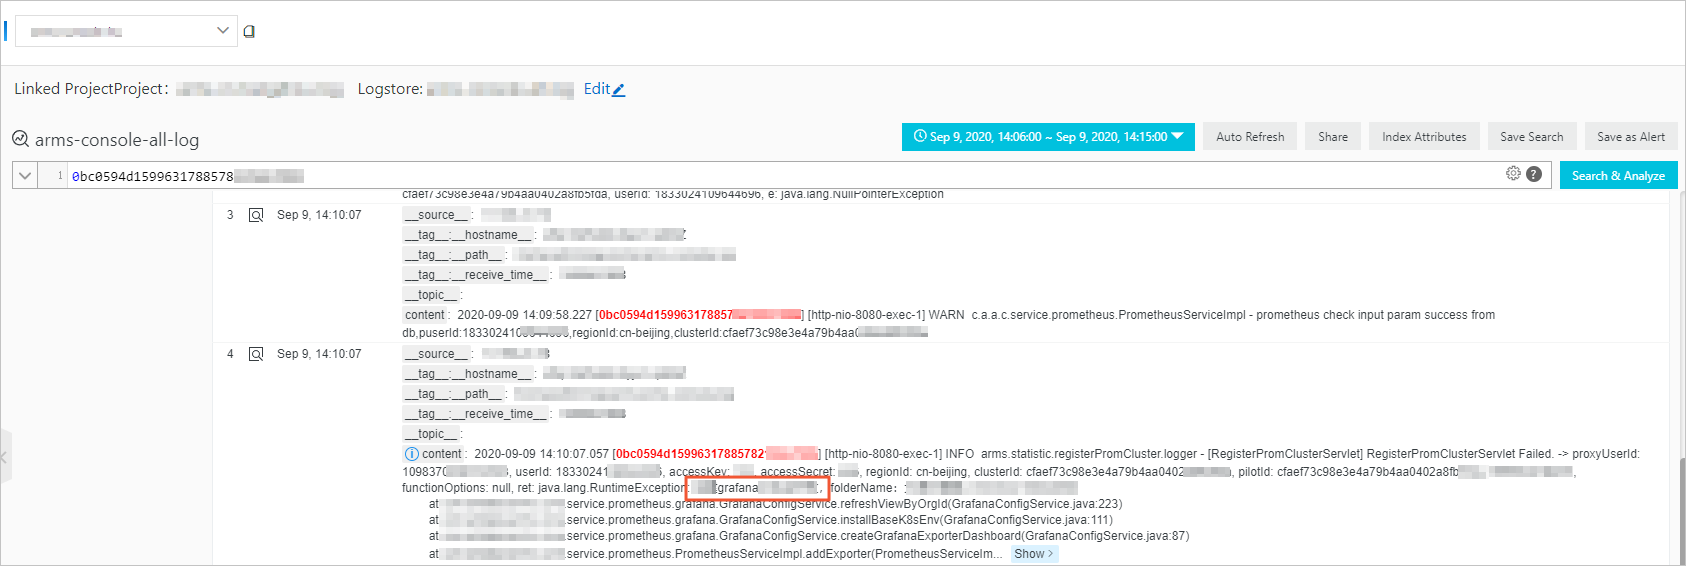
On the page that appears, perform the following operations:
Enter a query statement in the search box.
A query statement is in the Search statement|Analytic statement format. For more information, see Search syntax and Function overview.
Specify a time period for query.
You can set a custom time period by specifying the start time and end time. The start time and end time can be in hours or accurate to the second. You can also set a time length without specifying the start time or end time.
NoteThe query results may contain logs that are generated 1 minute earlier or later than the specified time period.
Click Search & Analyze to view the query and analysis results.
References
You can associate trace IDs with the business logs of an application. This way, if an error occurs in the application, you can access the business logs associated with trace IDs to identify and troubleshoot the error. For more information, see Associate trace IDs with business logs.