Cloud Monitor provides dashboards for you to get an overview of services, view monitoring details, and troubleshoot issues. This topic describes how to use dashboards in different scenarios.
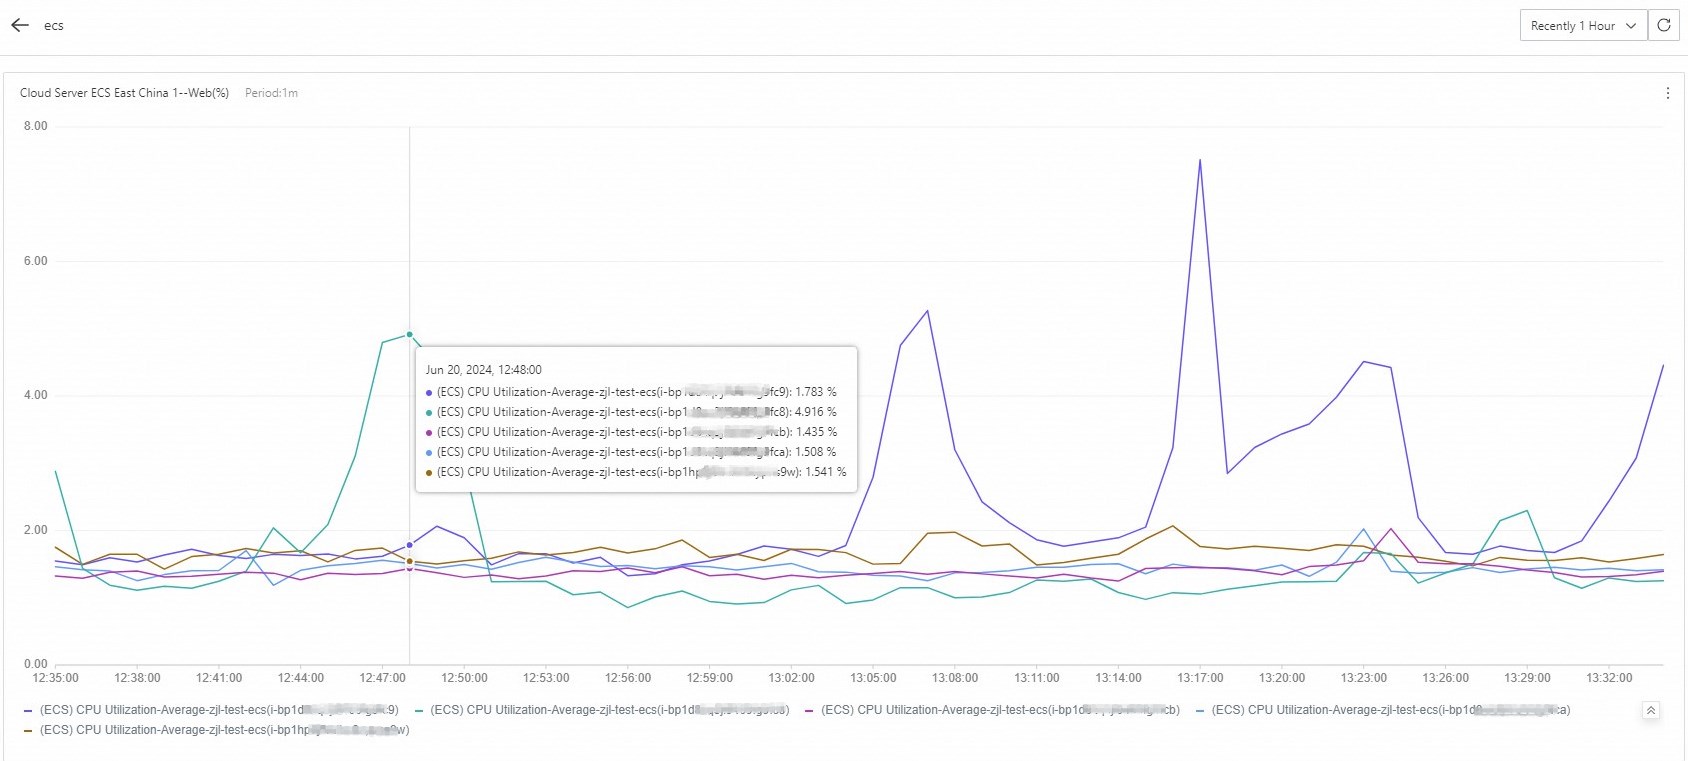
Display the monitoring data of multiple instances
Assume that your application is deployed on multiple Elastic Compute Service (ECS) instances. You can add the monitoring data of these ECS instances to the same monitoring chart to view the change trend of the monitoring data in one place. For example, you can view the change trend of the CPU utilization for multiple ECS instances in the same monitoring chart.
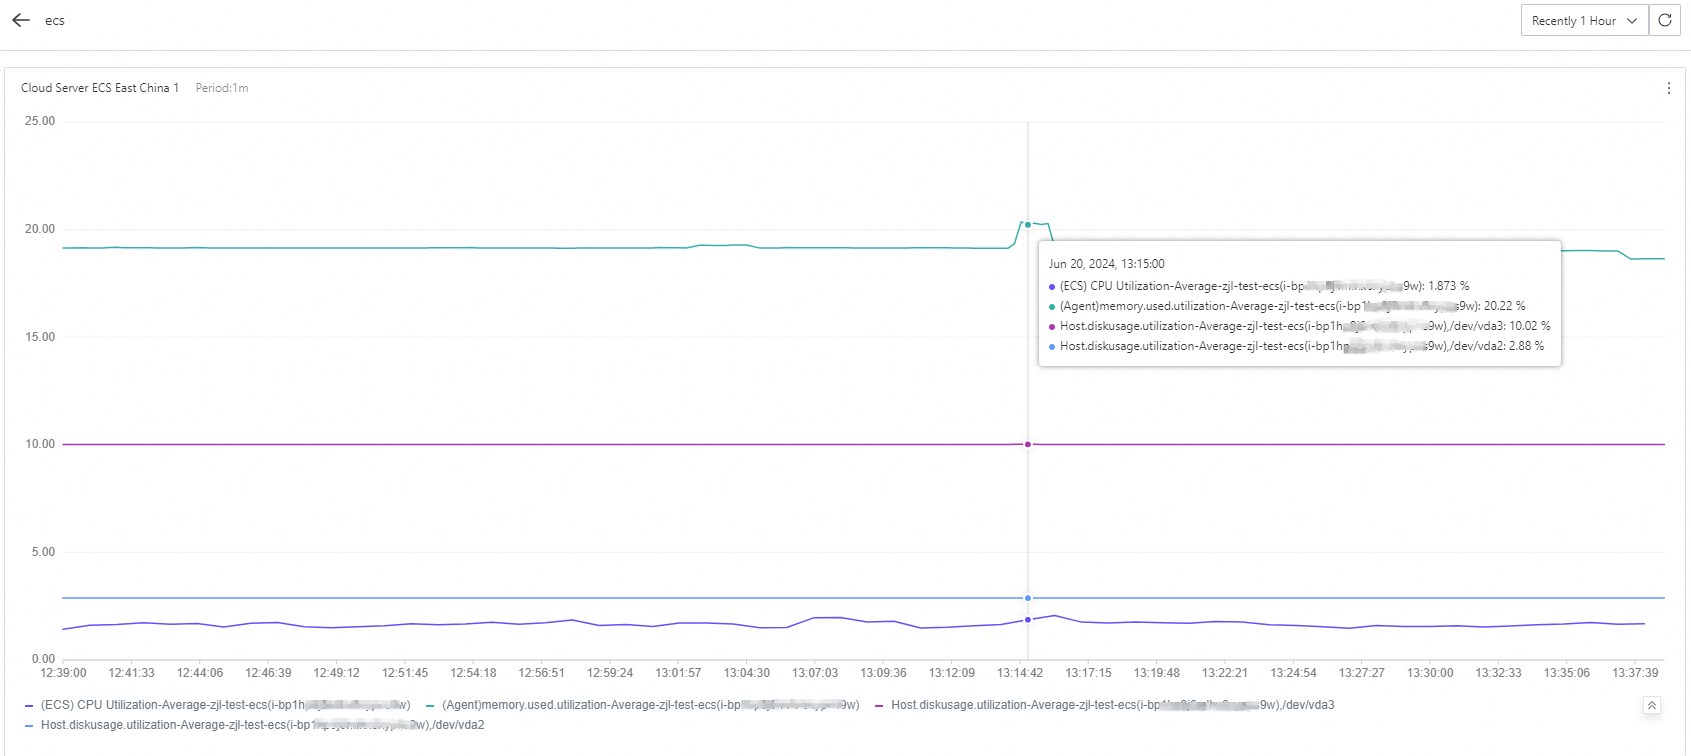
Display the monitoring data of multiple metrics
Cloud Monitor allows you to view multiple metrics of an ECS instance, such as the CPU utilization, memory usage, and disk usage, in the same monitoring chart.
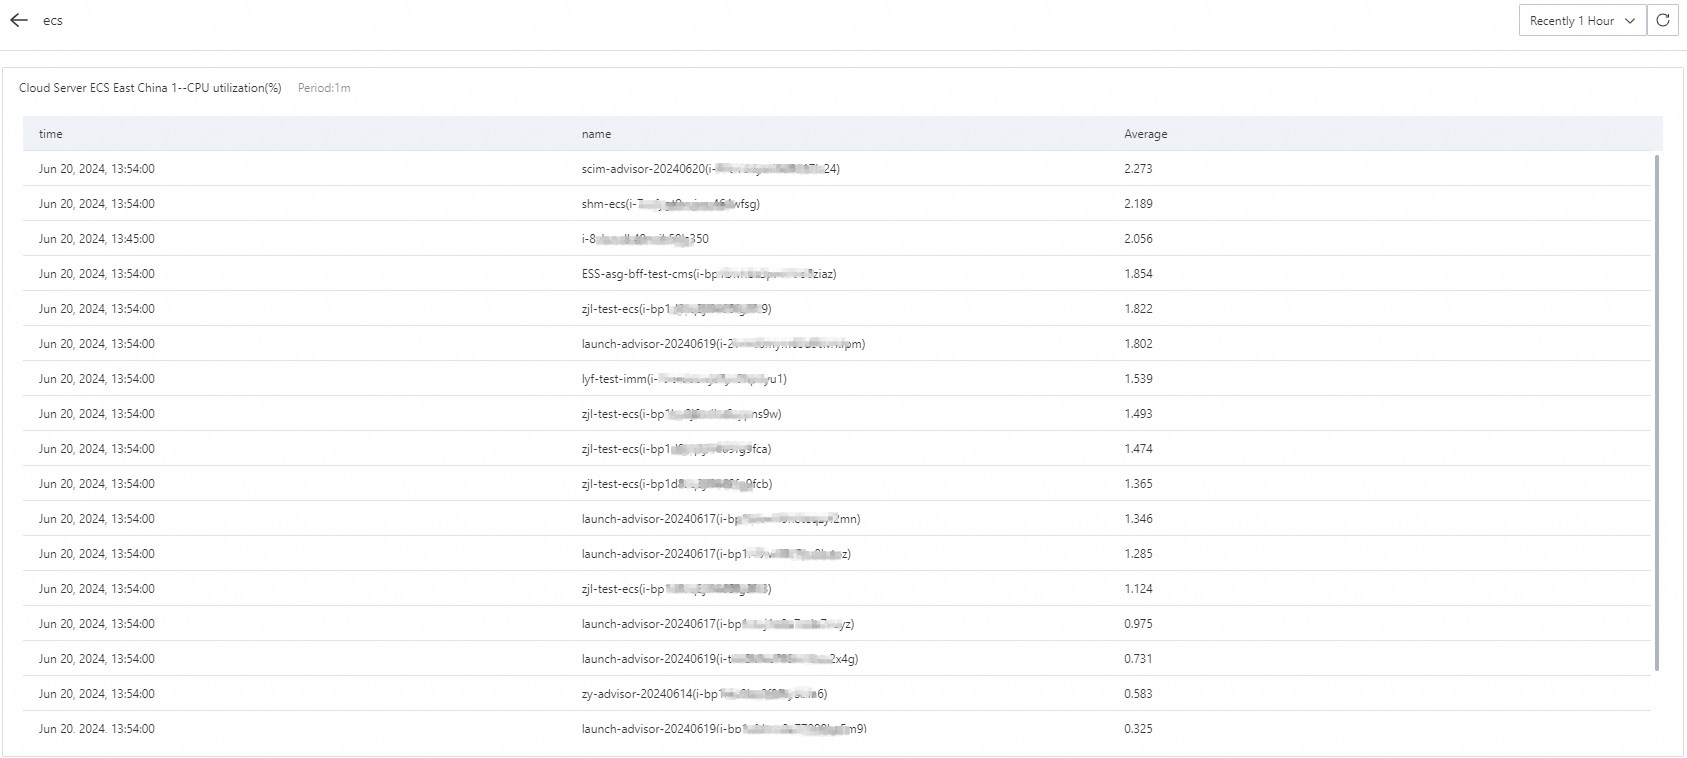
Sort the resource consumption of instances in a specific order
Assume that you have 20 ECS instances. You can sort the CPU utilization of the 20 instances in descending order. Then, you can allocate resources based on the resource consumption to reduce unnecessary costs.
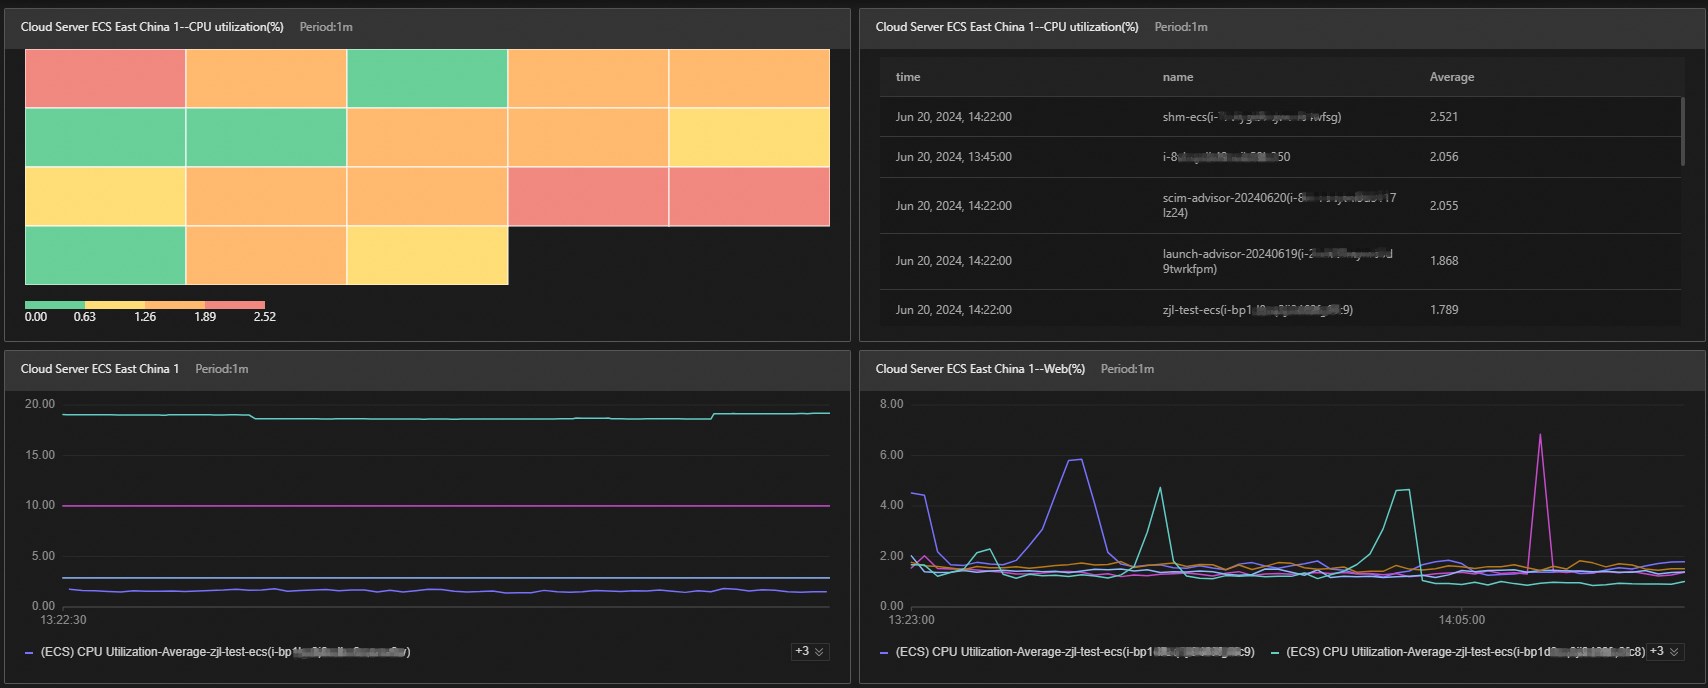
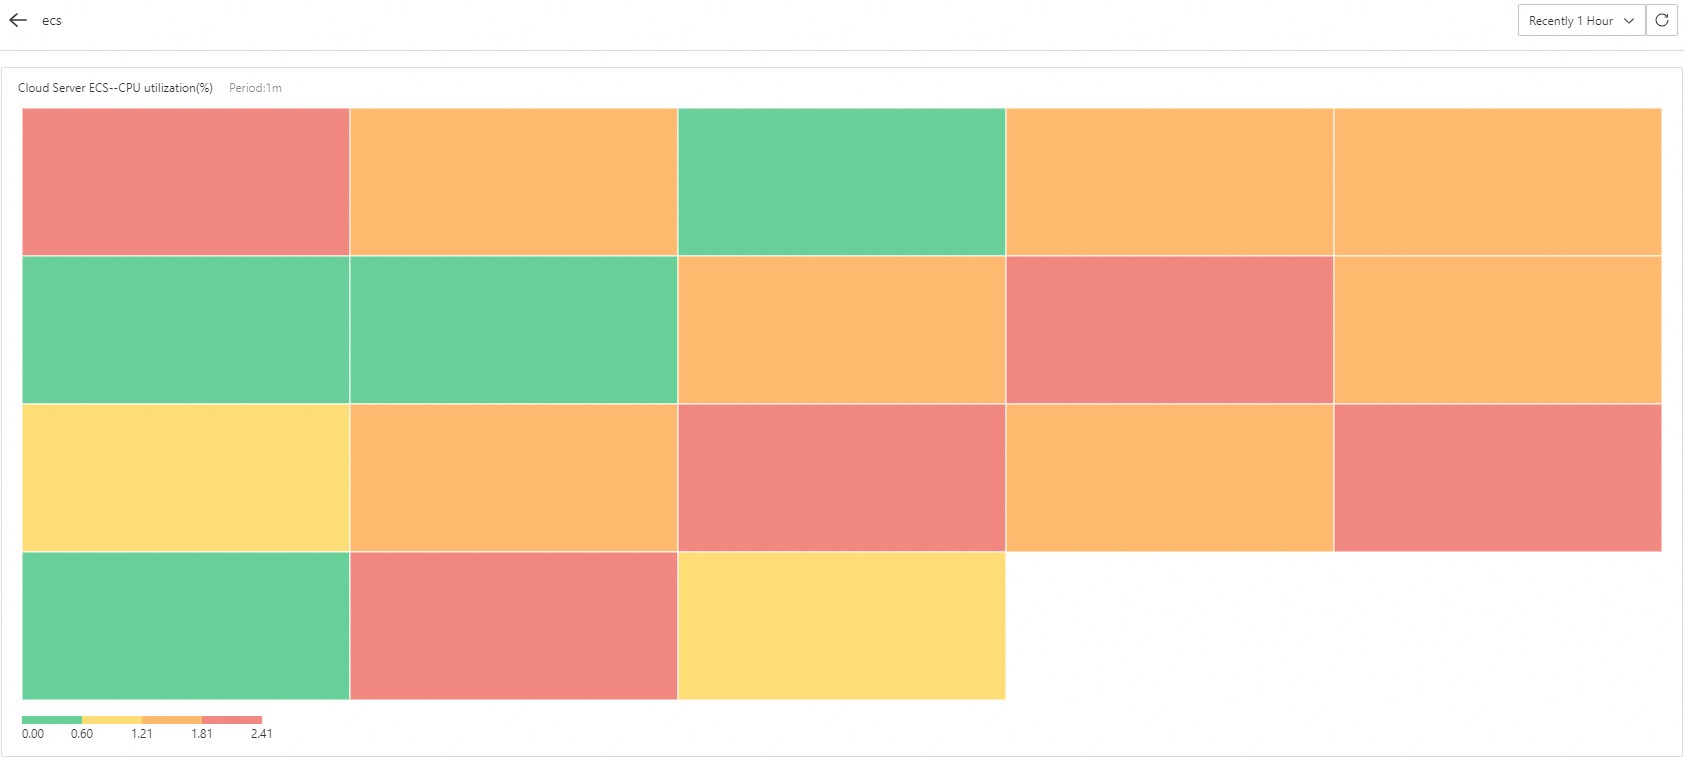
Display the monitoring data distribution of multiple instances in real time
For example, you can view the CPU utilization distribution of ECS instances and the differences of CPU utilization between ECS instances by using a heatmap. You can click a color block to view the change trend of the monitoring data for an ECS instance within a time period.
Display a dashboard in full screen
Dashboards support the full-screen mode and automatically update monitoring data. You can add a variety of metrics to a dashboard and display the dashboard in full screen.