Overview
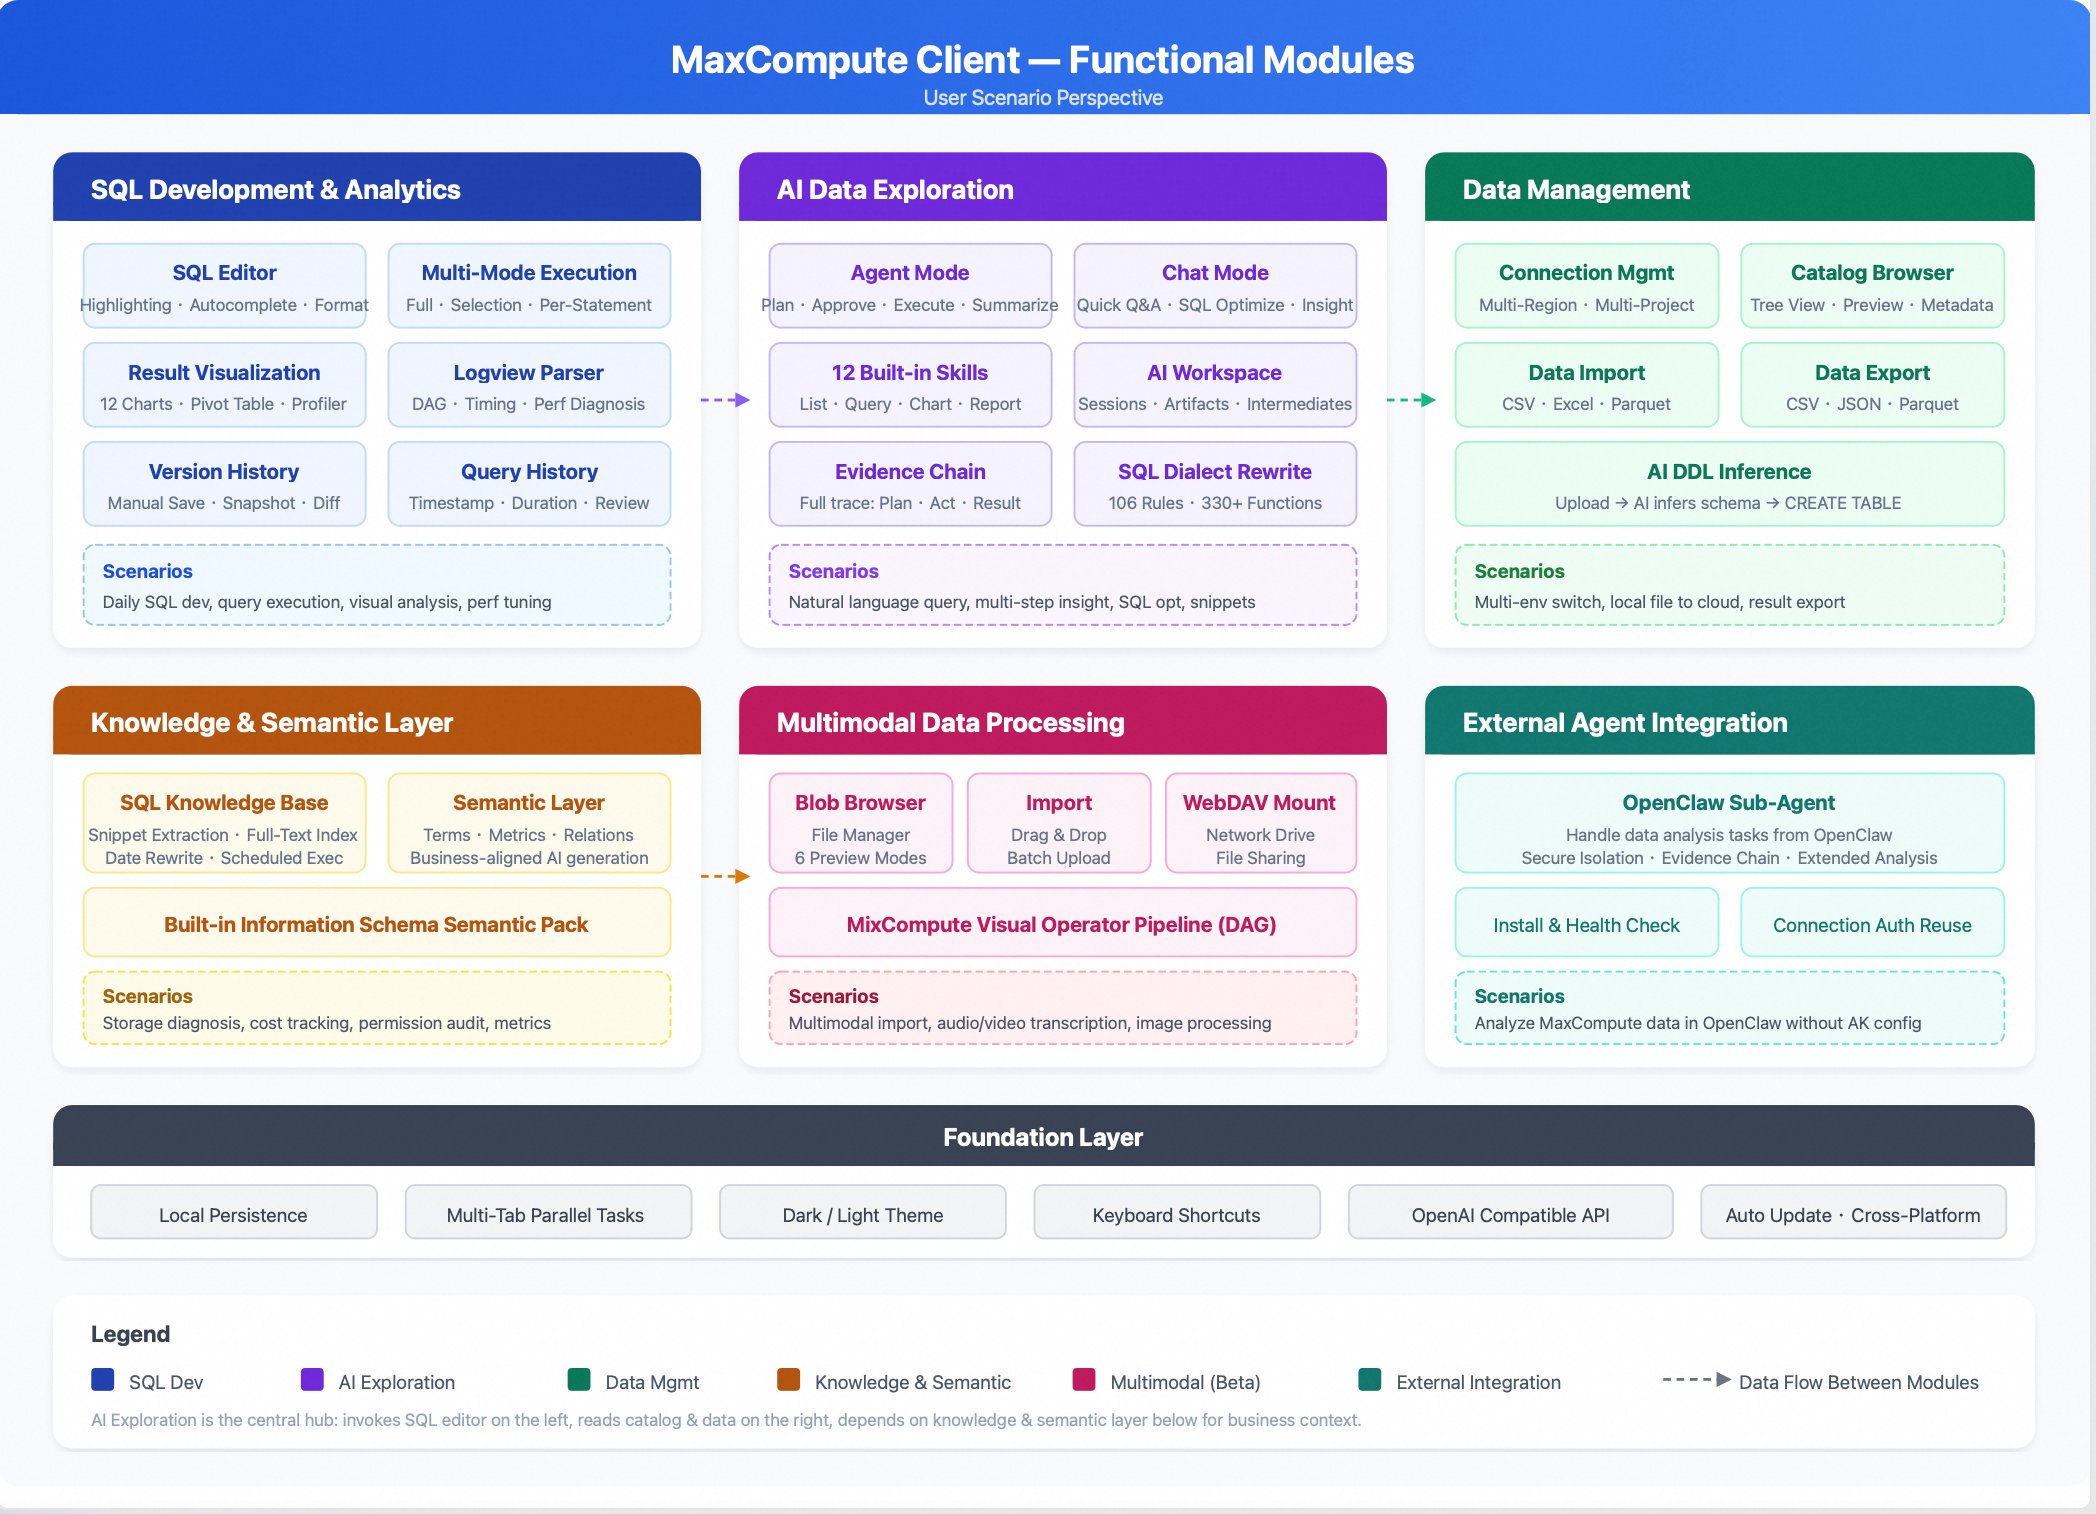
The MaxCompute AI data exploration client is a desktop tool for MaxCompute that integrates data development, data management, visual analysis, and AI-powered data exploration.
The client runs on your local desktop and connects to your MaxCompute project on startup. It persists your SQL scripts, connection configurations, query history, and AI sessions locally. This allows you to quickly restore your workspace when you reopen the client.
Download links
Feature index
Feature category | Features |
Cross-region and cross-project connections, AccessKey authentication, and connection testing | |
Syntax highlighting, intelligent completion, formatting, multi-file management, version history, and query history | |
Table view, 12 chart types, pivot table, data quality analysis, and Logview analysis | |
Catalog browsing, data preview, partition management, import (CSV, Excel, Parquet), and export (CSV, JSON, Parquet) | |
Conversational mode, agent mode, AI workspace, and multi-session management | |
SQL snippet knowledge base, semantic layer management, and semantic packages | |
blob file browsing, multi-format preview, and WebDAV mounting | |
OpenClaw Sub-Agent |
Quick start
Download and install
macOS
Download the DMG installation package.
Open the DMG file and drag the MaxCompute client to the Applications folder.
If you see a "developer cannot be verified" or "app is damaged" error on the first launch, open the terminal and run the following command:
sudo xattr -rd com.apple.quarantine "/Applications/MaxCompute.app"
Windows
Download the MSI installation package.
Double-click the installation package and follow the wizard to complete the installation.
After installation, find the MaxCompute client icon in the Start menu or on your desktop and double-click it to launch.
Console overview
The client uses a three-column layout:
Left Sidebar: Resource Management Area, which contains panels such as File Management, Catalog Browsing, Data Connections, Data Import, SQL Knowledge Base Search, Query History, and File Version History. Use the icons on the left to switch between these panels.
Middle Area: SQL Editing and Data Display Area, which supports multiple tabs.
Right Sidebar: AI Assistant Panel, which you can expand or collapse.
The client supports both dark and light themes. You can switch between them in Settings.
Configure data connection
In the left sidebar, click the connection icon to open the data connection panel.
Click Add Connection.
Enter the connection information:
Connection Name: Enter a descriptive name for the connection.
Region: Select the region where your MaxCompute project is located from the drop-down list, or select "Custom Endpoint" to enter it manually.
Project Name: Enter the name of your MaxCompute project.
AccessKey ID and AccessKey Secret: Enter the AccessKey ID and AccessKey Secret for project access.
Click Test Connection to verify the configuration.
Once the test passes, click Save.
Once the connection is successful, the Catalog panel in the left sidebar automatically loads the table structure of the project.
Run query
Press Option+N or click New in the file panel to create a new SQL file.
In the editor, enter a query, for example:
SELECT * FROM your_table_name LIMIT 10;Press Cmd+Enter (on macOS) to run the query.
Query results appear in the Result Panel below the editor. To analyze the results, you can switch between Table View, Chart View, and Pivot Table View.
Configure AI service
Click the gear icon in the upper-right corner to open Settings.
Go to the AI Configuration tab.
Enter the following information:
API URL: The endpoint for the AI service. The default is the endpoint for Alibaba Cloud Model Studio: https://dashscope.aliyuncs.com/compatible-mode/v1/.
API Key: Go to the Alibaba Cloud Model Studio console. In the upper-right corner of the page, select the China (Beijing) region. Navigate to the API Key page and click Create API Key or copy an existing one.
Model Name: The default is
qwen3-max-2026-01-23. You can also enter other models that are compatible with the OpenAI API.
Click Save.
After the configuration is complete, the AI Assistant panel on the right is ready to use. You can start exploring your data by asking questions in natural language.
AI data exploration
After completing the configuration, try the following in the AI Assistant panel:
Enter "List the tables in the current project." The AI Assistant then lists the tables.
Select a table and enter "Show the structure and first 10 rows of this table."
After reviewing the results, ask an analytical question, such as "Analyze the data volume distribution across partitions in this table."
The AI Assistant plans the steps, generates SQL, runs the query, and provides an analysis. You can observe this entire process in the interface.
Data connection management
The MaxCompute AI data exploration client uses data connections to connect to your cloud-based MaxCompute projects. You can manage multiple connections at once and quickly switch between different regions and projects.
Create a new connection
In the left sidebar, click the Connections icon to open the data connections panel.
Click Add Connection.
Configure the following parameters:
Parameter
Description
Connection Name
A custom name to identify the connection.
Region
Select the region where your MaxCompute project is located. The client automatically populates the corresponding endpoint.
Project Name
The name of your MaxCompute project.
AccessKey ID
The AccessKey ID for your Alibaba Cloud account.
AccessKey Secret
The AccessKey Secret for your Alibaba Cloud account.
Click Test Connection to verify the connection.
Click Save to create the connection.
If your MaxCompute project is deployed in a dedicated environment, you can select Custom Endpoint and manually enter the service address.
Test and troubleshoot connections
When you click Test Connection, the client attempts to connect to the MaxCompute service and retrieve project information. If the connection fails, check the following:
Ensure the endpoint matches the project's region.
Verify that your AccessKey is correct and has not expired.
Confirm that your current network environment can access the MaxCompute service in the specified region.
Check that the Alibaba Cloud account associated with your AccessKey can access the project.
Manage multiple connections
The data connections panel lists all your saved connections. From here, you can:
Switch connections:
Click a connection to make it active. Operations such as SQL execution, Catalog browsing, and data import use the active connection.
Delete a connection:
Click the delete icon on a connection to remove it. To modify a connection, delete the existing one and create a new one.
You can save multiple connections for different regions or projects and quickly switch between production, testing, and various business environments or projects.
SQL development and data analysis
SQL editor
The client includes a built-in, Monaco-based SQL editor for an IDE-like experience.
Syntax highlighting and intelligent completion
The editor highlights syntax for MaxCompute SQL and provides context-aware intelligent completion as you type. Suggestions include SQL keywords, MaxCompute built-in functions, and table and column names from the current connection. The completion list filters automatically based on the cursor's position. Typing a table name followed by a
.automatically suggests column names for that table.Code editing
The editor includes code folding, bracket pair colorization, word wrap, and a code minimap. Press Shift+Option+F to automatically format the current SQL script.
SQL script management
The File Panel in the left sidebar displays the SQL files in your local file system.
New file
Press Option+N (macOS) to create a new SQL file.
Open file
In the File Panel, click an existing SQL file to open it in the editor.
Save file
Press Option+S (macOS) to save your current changes.
Multi-tab operations
You can open multiple SQL files at once and switch between them using tabs.
SQL file version management
The client maintains a version history for each SQL file. Click the Version History icon in the left sidebar to view a list of historical versions for the current file.
Each version record includes a version number, save time, and version type. There are two version types: manual saves (created when you explicitly save a file) and pre-execution snapshots (backups created automatically before you run a SQL query).
You can perform the following operations on a version:
Compare differences: Double-click a version to open a diff view that shows the changes between that version and the current content.
Restore version: Restore the file content to a specific version.
Delete version: Remove historical versions you no longer need.
SQL execution
There are three ways to execute SQL:
Execute All: Press Cmd+Enter to execute all SQL statements in the editor.
Execute Selected: Select a portion of SQL text and press Shift+Enter to execute only the selection.
Single-Statement Execution: The editor displays a Run button between each SQL statement. Click it to execute that specific statement.
If a SQL file contains SET statements, such asSET odps.sql.type.system.odps2=true;, the client automatically merges this configuration with subsequent SQL statements and executes them together.
During execution, the editor displays a progress bar and run status below. When complete, query results appear in a table, while an execution status appears for DDL/DML statements.
Query result analysis
After a query returns results, you can use the following views for in-depth analysis.
Table view
By default, query results appear in a table. You can sort by column, resize columns, and browse results by page.
Chart view
Switch to the Chart View to visualize your query results as one of the following 12 chart types:
Column, Line, Area, Scatter, Pie, Doughnut, Bar, Radar, 3D Column, 3D Scatter, 3D Surface, and 3D Heatmap.
After selecting a chart type, you can customize the X-axis, Y-axis, and grouping dimensions. The system automatically recommends suitable axis mappings based on the data types of the columns.
Pivot table
Switch to the Pivot Table view to perform multidimensional cross-analysis on your query results.
Row Dimension: Select up to three fields for row grouping.
Column Dimension: Select one field for column grouping.
Value Column: Select one numeric field for aggregation.
Aggregate Function: Supports SUM, COUNT, AVG, MIN, and MAX.
The pivot table automatically calculates row and column totals.
Data profiler
Switch to the Data Profiler view, where the system automatically scans your query results for data quality and generates the following metrics:
Overall quality score
A weighted score based on completeness (null value rate), uniqueness (duplication rate), and consistency (format consistency).
Per-column statistics
Includes the number of unique values, the percentage of null values, and a quality rating. For numeric columns, it also shows the minimum, maximum, average, and sum values. Additionally, it lists the top three most frequent values for each column.
Logview parsing
After a query completes, the client parses summary metrics from Logview, including Directed Acyclic Graph (DAG) stage information, the duration of each stage, and record counts. The results panel displays these metrics directly, letting you review the job execution at a glance without navigating to the Logview page.
Query history
Click the History icon in the left sidebar to browse your query history. Each record shows the execution time, duration (in milliseconds), a preview of the SQL statement, the execution status (success or failure), and the number of rows returned. You can click a record to load that SQL statement back into the editor.
The query history supports pagination, making it easy to review and reuse past queries.
Data management
Browse Catalog
In the left sidebar, click the Catalog icon to view all tables in the current project, displayed as a tree structure. Expand any table to view its column definitions, including the column name, data type, and comment.
Right-click a table name to perform the following actions:
Data Preview: View the first few rows of data in the table.
View table schema: Displays the complete column information, partition key, and table properties.
View table information: Displays metadata such as the table size, record count, last modified time, and permissions.
If you have multiple connections saved, the Catalog displays the table schemas for all connected projects, making it easy to browse and compare them.
Data preview
Select a table in the Catalog to preview its data. The system automatically runs a query with a LIMIT clause and displays the results as a table in the central pane.
Partition management
You can view the list of existing partitions in the Catalog and add new partitions to a partitioned table.
Data import
The client supports importing local files into MaxCompute tables. To open the import panel, click the Data Import icon in the left sidebar.
Supported file formats
CSV, Excel (.xlsx / .xls), and Parquet.
Import workflow
Upload a file: In the import panel, select or drag and drop a local file.
Data preview: After the file is parsed, the system displays a preview of the first 20 rows so you can confirm its content.
Select an import mode:
New table:
The client automatically infers a DDL statement from the file schema, which you can view and modify in the built-in editor. You can also click AI Generate DDL to refine column types and comments using AI.
Append to existing table:
Select a target table to append the file data to.
Configure the target: Select the target connection and project, and enter the target table name. The system automatically checks for name conflicts.
Start the import: After confirming your settings, click Start Import.
Import task management
All import tasks are listed in the import panel. You can view the status (Queued, Uploading, Parsing, Importing, Succeeded, or Failed), progress, and log for each task.
Data export
You can export query results in the following formats:
CSV: A comma-separated text file compatible with tools like Excel.
JSON: Data in JSON format.
Parquet: A columnar storage format suitable for further processing in big data scenarios.
In the query result panel, click the Export button and select a format.
AI data exploration
The MaxCompute client includes a built-in AI assistant that lets you interact with your MaxCompute data using natural language. The AI assistant is located in the right-side panel of the interface and can be expanded at any time.
Chat mode and agent mode
The AI assistant provides two working modes:
Chat mode is ideal for quick Q&A and lightweight operations, such as explaining the meaning of a SQL statement, optimizing SQL code, or suggesting insights based on your current query results. Your questions are answered directly by the AI without requiring a multi-step process.
Agent mode is designed for data analysis tasks that require multiple steps. The AI first creates an execution plan. After you approve the plan, the AI executes it step by step. This process can include querying metadata, generating SQL, running queries, and analyzing results to provide a conclusion.
Chat mode
Enter a question directly into the input box in the AI panel to use chat mode. Common use cases include:
SQL generation: Describe your query requirements, and the AI generates the corresponding MaxCompute SQL.
SQL optimization: Open a SQL script in the editor and ask the AI for optimization suggestions. You can then insert the optimized SQL into the editor with a single click.
SQL explanation: Select a complex SQL statement and ask the AI to explain its logic section by section.
Result insights: After running a query, ask the AI for insights on the results, such as trend analysis or anomaly detection.
Agent mode
When you ask an analytical question that involves multiple steps, the AI automatically enters agent mode.
Execution flow
Planning: The AI generates an execution plan based on your question, listing the steps to be performed, such as retrieving table schema, running a query, or analyzing results.
Approval: The execution plan is displayed on the interface. You can review each step and decide whether to approve it, skip certain steps, or request a new plan.
Execution: After approval, the AI executes the plan step by step. The input and output for each step are displayed in real time. If a step requires your confirmation, such as executing a DDL operation, a confirmation card appears.
Summary: After all steps are complete, the AI provides a final analysis and recommendations.
Built-in capabilities
In agent mode, the AI can use the following capabilities:
Capability | Description |
List projects | Lists all connected MaxCompute projects. |
List tables | Lists all tables in a specified project. |
Get table schema | Gets the column names, data types, and comments for a table. |
Batch get table schemas | Gets schema information for multiple tables in a batch. |
Get partition list | Gets the partition list of a partitioned table. |
Get table statistics | Gets the row count, size, and update time for a table. |
Add partition | Adds a new partition to a partitioned table. |
Execute query | Executes a SQL query and automatically injects a row limit. |
Search SQL knowledge base | Searches the SQL snippet knowledge base for matching SQL templates. |
Execute SQL snippet | Executes a SQL snippet from the knowledge base and supports rewriting date parameters. |
Generate chart | Generates a chart from query results. |
Save report | Saves the analysis report as a local file. |
Plan editing
During execution, you can dynamically adjust the plan:
Skip step: Skip a step that has not yet been executed.
Insert step: Insert a new execution step at the current position.
Reorder steps: Adjust the execution order of subsequent steps.
Execution process visualization
The execution status, input parameters, output results, and duration of each step are displayed in real time. After the execution completes, you can view the full execution trace in the diagnostics panel.
AI workspace
The AI Workspace is a persistent local directory that stores output from agent mode. Intermediate results and final outputs from each AI analysis task are automatically saved to the workspace.
Workspace file browser
In the left sidebar, click AI Workspace to expand the workspace file tree and browse all files generated by your sessions. Files in the workspace include:
Query results: Data from each query is saved in CSV format.
Chart configurations: Charts generated by the AI are saved in JSON format.
Analysis reports: Reports generated by the agent are saved in Markdown format.
Execution plan and step records: Complete snapshots of the plan and execution steps.
Click any file to open it. The editor displays CSV files in a table view, Markdown files in a rendered view, and JSON files as formatted text.
Session management
The AI assistant supports multiple sessions. Each session independently saves its conversation history and execution state. You can:
Create a new session to start a new analysis topic.
Switch to a previous session to continue an unfinished analysis.
Session content is saved locally, so you can restore it even after closing and reopening the client.
Accessing intermediate results
When performing a multi-step analysis in agent mode, you can view and export the query results from each step. For example, in an analysis task with five steps, you can view the results table for each step after it completes and click Export to save the intermediate result as a CSV file.
This allows you to validate the data at each step, in addition to reviewing the AI's final conclusion. It also simplifies further manual exploration based on the AI's analysis.
Use cases
Quick metadata Q&A
This mode is ideal for quickly retrieving basic information about your projects and tables. For example:
"List the tables in the current project."
"Show the schema for the 'orders' table."
"Show the first 10 rows of the 'user_log' table."
"Show the partition information for the 'dwd_trade_detail' table."
These requests are typically processed quickly and do not require a full execution plan.
Multi-step data analysis and insights
This mode is suitable for analysis tasks that require multiple steps. For example:
"Analyze the conversion rate trends for each channel over the last 7 days, and identify the channel with the most significant drop and its possible causes."
"Compare the storage usage and growth trends across different business lines, and identify the top 5 tables that should be prioritized for governance."
The AI automatically plans query steps, executes SQL, analyzes the results, and provides a conclusion supported by data.
SQL snippet execution
If the SQL knowledge base includes frequently used business SQL templates, you can call them directly using natural language. For example:
"Execute SQL snippet: storage reduction analysis"
"Execute daily active user statistics, and change the date to the last 3 days"
The AI finds the matching SQL snippet in the knowledge base, rewrites the date parameters, and then executes it.
Knowledge base and semantic layer
SQL snippet knowledge base
The sql snippet knowledge base stores reusable SQL templates for periodic data retrieval. Maintaining standardized business SQL in the knowledge base lets you use the AI's date rewriting to quickly retrieve report data for different time periods. When you import frequently used SQL files into the knowledge base, the system automatically extracts individual sql snippets. For each snippet, it then extracts table names, keywords, partition fields, and date literals to build a full-text index.
Click the search icon in the left sidebar to search the knowledge base for sql snippets by keyword. After finding a snippet, you can insert it into the editor for execution. Alternatively, you can use the AI assistant's "Execute SQL Snippet" feature to automatically match a snippet, rewrite its date, and execute it.
Semantic layer
Semantic layer management is a Beta feature. To use this feature, enable the semantic package switch in Settings.
The semantic layer is a key feature that distinguishes the MaxCompute client from general-purpose AI tools. It maps tables and columns from your database to business-friendly terms, metrics, and relationships. When generating SQL, the AI consults the semantic layer to produce more accurate queries.
The semantic layer consists of the following components:
Business term: Defines a specialized term in your business domain, such as 'DAU' for 'Daily Active Users'.
Entity definition: Describes core business objects and their corresponding tables and key fields.
Metric definition: Defines the calculation formulas and scope for business metrics, such as
Conversion Rate = Number of users who placed an order / Number of visiting users.Table relationship: Describes the JOIN relationships and join keys between tables.
Validated query: A standard, validated query template that the AI can reuse for similar questions.
Analysis playbook: A predefined template for analysis scenarios and steps that guides the AI to complete an analysis following a standard workflow.
Built-in semantic package
The client includes a built-in semantic package for Information Schema that covers common analysis scenarios for the MaxCompute tenant-level meta-warehouse. These scenarios include storage pressure diagnosis, cost pressure diagnosis, job performance analysis, task failure surge analysis, user role audits, permission exposure audits, hot table observation, and resource quota monitoring.
After you enable this semantic package, you can ask the AI meta-warehouse analysis questions directly, such as "Analyze the top 10 tables by storage in the current project." The AI then uses the metric definitions and reference queries from the semantic package to generate accurate analysis SQL.
Custom semantic package
Create a custom semantic package for your specific business scenarios. In the Semantic Layer Management panel, after selecting a target domain, you can edit business terms, entity definitions, metric definitions, table relationships, validated queries, and analysis playbooks individually. You can also use AI assistance to automatically generate a draft semantic package from the current connection's table structure. You can then manually adjust and optimize this draft.
Multimodal data processing (Beta)
The features described in this section are in Beta. To use them, enable the corresponding Beta feature switches in Settings.
Blob file browser
MaxCompute lets you store binary file data in columns of the blob type. The client provides a blob file browser that works like a file manager, allowing you to browse tables that store blob data in MaxCompute. To use this feature, enable the file browser Beta switch.
The blob file browser supports switching between grid view and list view, breadcrumb navigation, folder creation, and file upload/download.
Blob file import
In the Data Import panel, you can switch to blob import mode to upload files in bulk to a MaxCompute blob table with drag-and-drop. The client automatically extracts metadata, such as file path, name, and type, and writes it to the corresponding columns in the table.
If the target table does not exist, the client helps generate a table creation statement that includes a blob type column.
Multimodal file preview
The client provides built-in multimodal file preview for the following formats:
File type | Preview method |
Image | Direct rendering |
Video | Playback in an embedded player |
Audio | Playback in an embedded player |
Document rendering | |
Text | Display in text format (supports JSON, XML, and plain text) |
HEX | View raw bytes in hexadecimal format |
The client automatically matches the preview method based on the file's MIME type, but you can also switch it manually.
WebDAV mount
The client includes a built-in WebDAV service that lets you mount a MaxCompute table containing blob files as a local folder. After you mount the table, you can preview and download files directly in Finder without using the client interface.
How to mount on macOS:
In Finder, press Cmd+K and enter http://localhost:8899/dav/ to browse the files in the blob table as a network folder.
External agent integration
OpenClaw sub-agent
The MaxCompute client integrates as an OpenClaw Sub-Agent to handle data analysis tasks delegated by OpenClaw.
In this mode, OpenClaw controls and orchestrates tasks, while the MaxCompute client handles data analysis. The advantages of this collaboration include:
Security isolation: MaxCompute connection credentials are managed locally on the client. You do not need to configure an AccessKey in OpenClaw.
Complete audit trail: OpenClaw maintains a simple conversational experience, while the client stores the detailed execution process, including the plan, SQL, intermediate results, and diagnostic information, for tracking and review.
Extended analysis: You can further analyze and export results from OpenClaw in the client's Studio mode.
Installation
One-click installation
In the client settings, go to the OpenClaw tab and click Install OpenClaw Plugin. The client automatically completes the plugin installation and configuration. After installation, you can click Health check to confirm the status.
The health check verifies that:
The OpenClaw CLI is installed.
The MaxCompute plugin is installed.
The OpenClaw gateway is running correctly.
The connection is secure and uses a loopback address.
Manual installation
If one-click installation is not suitable for your environment, you can install it manually from the command line:
# Install the MaxCompute plugin
openclaw plugins install @maxcompute/openclaw-maxquery --pin

# Enable the plugin and configure the connection address
openclaw plugins enable maxquery
openclaw config set plugins.entries.maxquery.enabled true
openclaw config set plugins.entries.maxquery.config.baseUrl http://127.0.0.1:8899
Use cases
After installation, you can use the MaxCompute client's data analysis capabilities directly from your OpenClaw conversations. Typical scenarios include:
Quick Q&A
Ask data-related questions directly in OpenClaw, such as "Show the first 10 rows of the 'orders' table." The client quickly returns the results.
Data analysis and insights
Ask analytical questions, such as "Analyze campaigns with an ROI below 1 among the top 5 campaigns by cost_amount in the past 7 days, and provide optimization suggestions." The client performs a complete, multi-step analysis and returns a conclusive report.
SQL snippet execution
Call SQL templates from the client's knowledge base, for example, "Run SQL snippet: storage reduction analysis."
Settings and personalization
Click the gear icon in the upper-right corner to open the Settings panel.
Editor settings
Parameter | Description | Default |
Font Size | The font size in the editor. | 14px |
Tab Size | The indentation width. | 4 |
minimap | Shows or hides the code minimap. | On |
word wrap | Toggles automatic wrapping for long lines. | On |
AI settings
Parameter | Description | Default |
API URL | The endpoint for the AI service (OpenAI-compatible). | Alibaba Cloud Model Studio (DashScope) |
API Key | The API key for the AI service. | None |
model name | The ID of the model to use. | qwen3-max-2026-01-23 |
Advanced AI settings
Parameter | Description | Value | Default |
context length | The maximum number of data rows to include in the AI context. | 8K - 512K | 120 |
Max Steps | The maximum number of execution steps for a single agent task. | 10 - 200 | 30 |
temperature | Controls the randomness of the generated output. | 0 - 1 | 0.7 |
Step Timeout | The timeout for a single step, in seconds. | 60 - 600 | 120 |
max parallel tool calls | The maximum number of concurrent tool calls. | 1 - 8 | 4 |
Session History Size | The number of past conversation turns to retain. | 1 - 20 | 5 |
inference profile | The strategy for AI inference depth. | auto / fast / balanced / deep / fixed | auto |
Theme settings
Switch between Dark and Light themes.
Version update
The application automatically checks for updates and prompts you to install new versions when available.
MaxCompute client comparison
Features | MaxCompute AI Explorer | ODPSCMD | MaxCompute Studio |
Client type | Desktop application | Command-line tool | IntelliJ IDEA plugin |
Use case | SQL development, data analysis, and AI-assisted insights | Operations and maintenance, automation scripts | SQL/UDF development |
Multi-Project connection | Supported | Not supported | Supported |
SQL editing | Syntax highlighting, completion, and multi-file management | Plain-text command line | Syntax highlighting, completion, and multi-file management |
Query results | Table, chart, and pivot table views; Logview parsing | Text output | Table view and Logview parsing |
Import/export |
| CSV (Tunnel) | CSV |
AI capabilities | Built-in AI chat and Agent data exploration | None | None |
FAQ
macOS installation verification error
The macOS Gatekeeper security feature causes this error but does not compromise the application's security. To fix this, open Terminal, run the following command, and restart the application:
sudo xattr -rd com.apple.quarantine "/Applications/MaxCompute.app"Connection issues
Connection test fails
Check the following items in order:
Ensure the
endpointmatches theregionof your MaxComputeproject. You can verify the correctregionon theprojectdetails page in the MaxComputeconsole.Verify that the
AccessKey IDandAccessKey Secretare correct and have not been disabled or expired.Confirm that your network can access the MaxCompute
public endpointfor the specifiedregion. If you are behind a VPN or proxy, ensure that your network policy allows outbound connections.Ensure that the account associated with the
AccessKey IDis authorized to access the targetproject.
Connection times out
Network issues typically cause this timeout. High latency, especially when connecting to a cross-border
region, such as accessing an overseasregionfrom the Chinese mainland, can lead to timeouts. Check your network connectivity or contact your network administrator.
SQL execution issues
SQL execution returns a syntax error
MaxCompute SQL differs from standard SQL. The client has built-in compatibility rules to automatically rewrite some syntax before execution (for example, converting
NOW()toGETDATE()), but this does not cover all cases. Refer to the official MaxCompute SQL documentation to confirm the correct syntax.Query returns a large volume of data
By default, the client limits the number of rows in query results to ensure responsiveness. To retrieve more data, add a
LIMITclause to your SQL statement or use the data export feature to obtain the complete result set.
AI configuration issues
AI assistant is not working
Ensure you have correctly configured the API URL,
API key, and Model Name in the settings. The default configuration usesModel Studio(DashScope); to use it, you must first create anAPI keyin theModel Studioconsole.AI responses are slow
Model service load and network conditions affect the
AI assistant's response speed. For faster responses, switch theinference service tiertofastin the advanced AI settings or choose a more responsive model.
Import and export issues
Incorrect column types after importing an Excel file
The client automatically infers column types when parsing an Excel file. If the inferred types are incorrect, manually modify the column type definitions in the
DDLin Create New Table mode, or use the AI Generate DDL feature for more accurate type inference.Cannot open an exported Parquet file
Exported
Parquet files adhere to the Apache Parquet format and can be read by tools that support Parquet, such as Python (pandas/pyarrow) and Spark.