For apps, Quick Tracking provides five system presets: Overall Trend, Time-sharing Insights Trend, New Users, Active Users, and Retained Users. The following table shows the metrics and calculation criteria of each dashboard.
Overall Trend
Overall Trend includes 10 reports, namely Number of Active Devices, Number of Active Accounts, Number of Key Actions, Key Indicator Trends, Past 30 Days | Key Indicator Trends, TOP 10 Page Views | Number of Devices, TOP 10 Control Clicks | Number of Devices, TOP 10 Custom Events | Number of Devices, Add New Device | Visit Retention, Active Devices | Visit Retention. Through these 10 reports, the overall data of App can be quickly understood. The following is an interpretation of the calculation caliber of the above reports one by one.
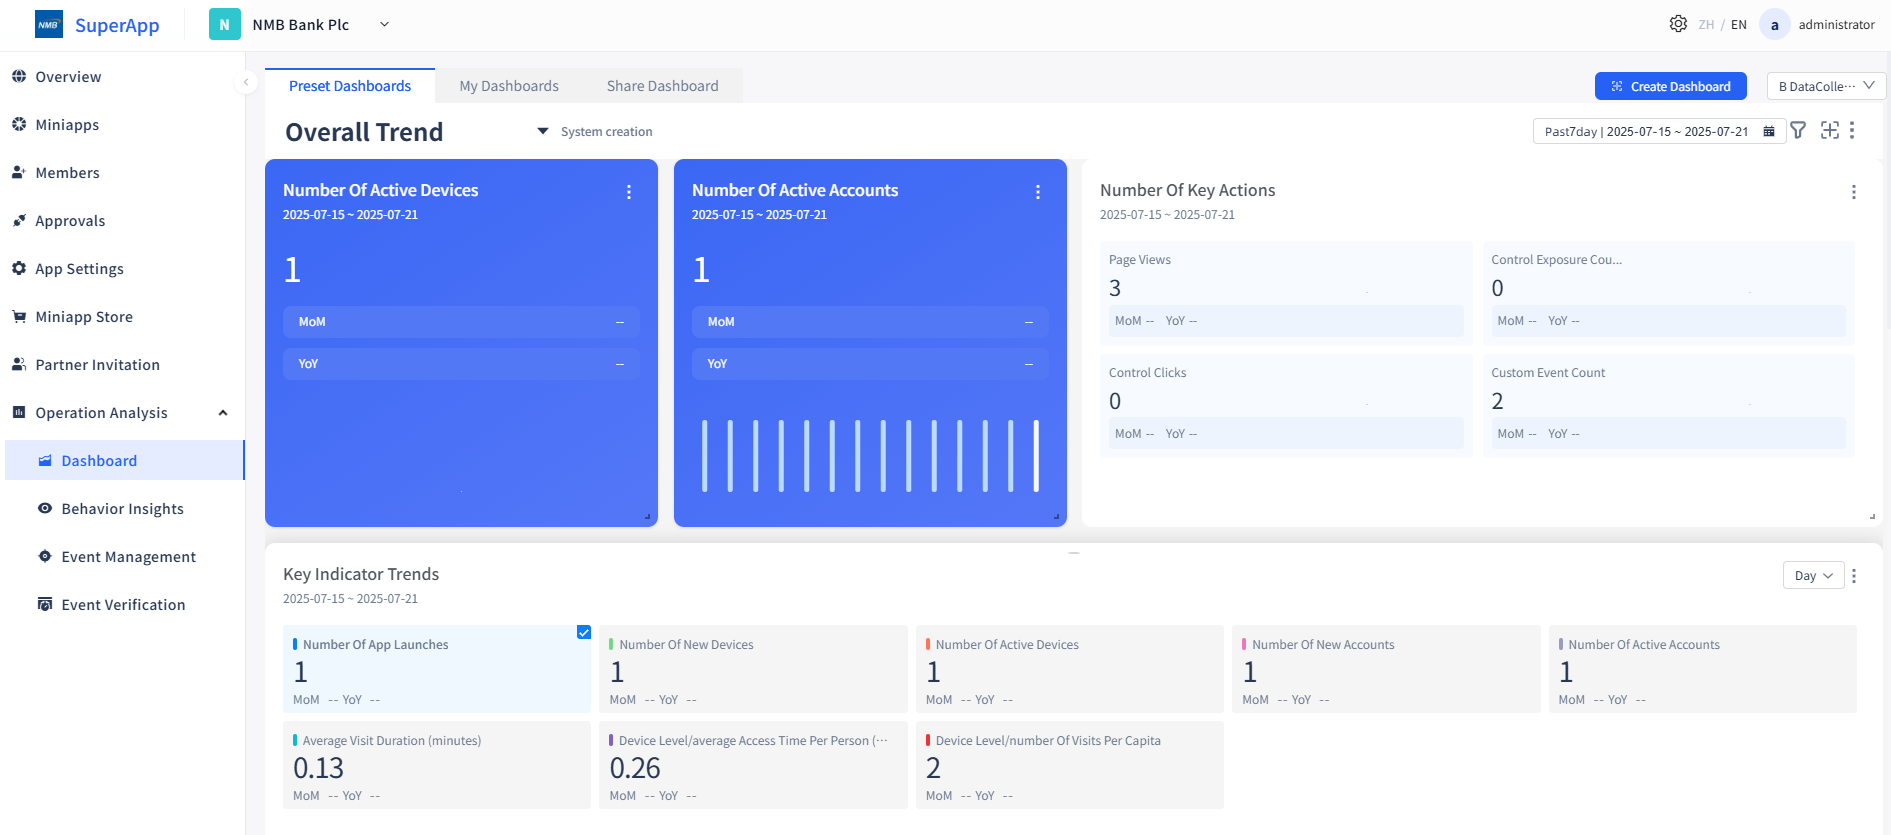
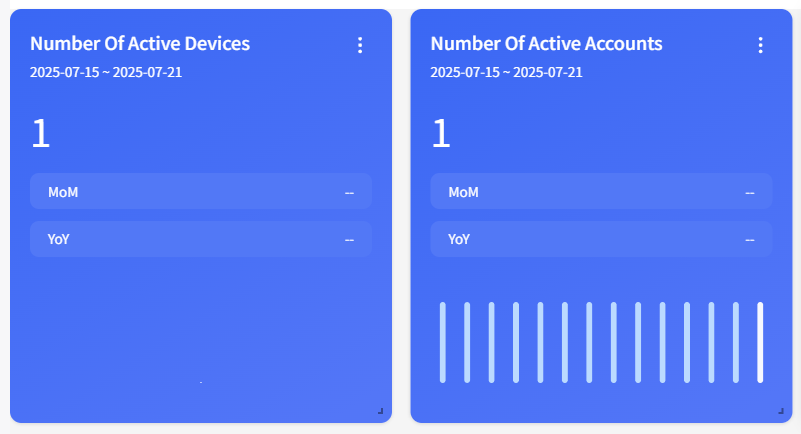
1. Number of Active Devices
This metric is used to collect statistics on the number of devices with arbitrary behavior records within a specified time range. You can filter and compare analyses by time period.
2. Number of Active Accounts
This metric is used to count the number of user accounts with arbitrary behavior records within a selected time range. It supports flexible filtering by time range and provides the periodic comparison function to analyze the active trend of accounts.
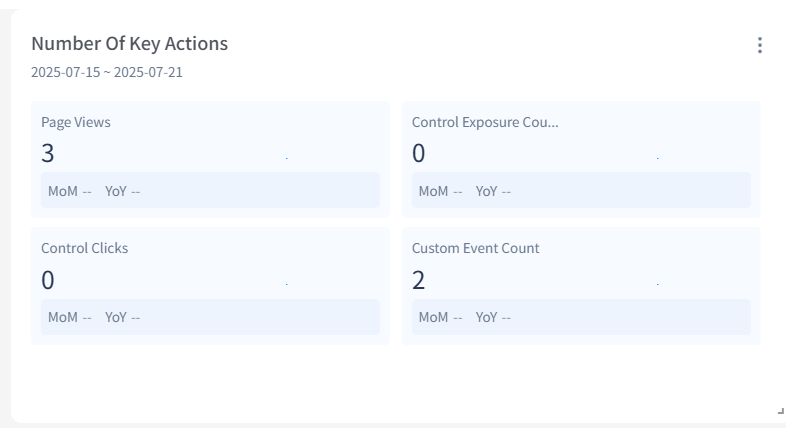
3. Number of Key Actions
Page Views: The number of device IDs that triggered the pageview event during the selected time.
Control Exposure Count: The number of device IDs that triggered the page control exposure event during the selected time.
Control Clicks: The number of device IDs that triggered the control click event during the selected time.
Custom Event Count: Number of device IDs that fired any event and the system property Event Type was equal to the custom event during the selected time.
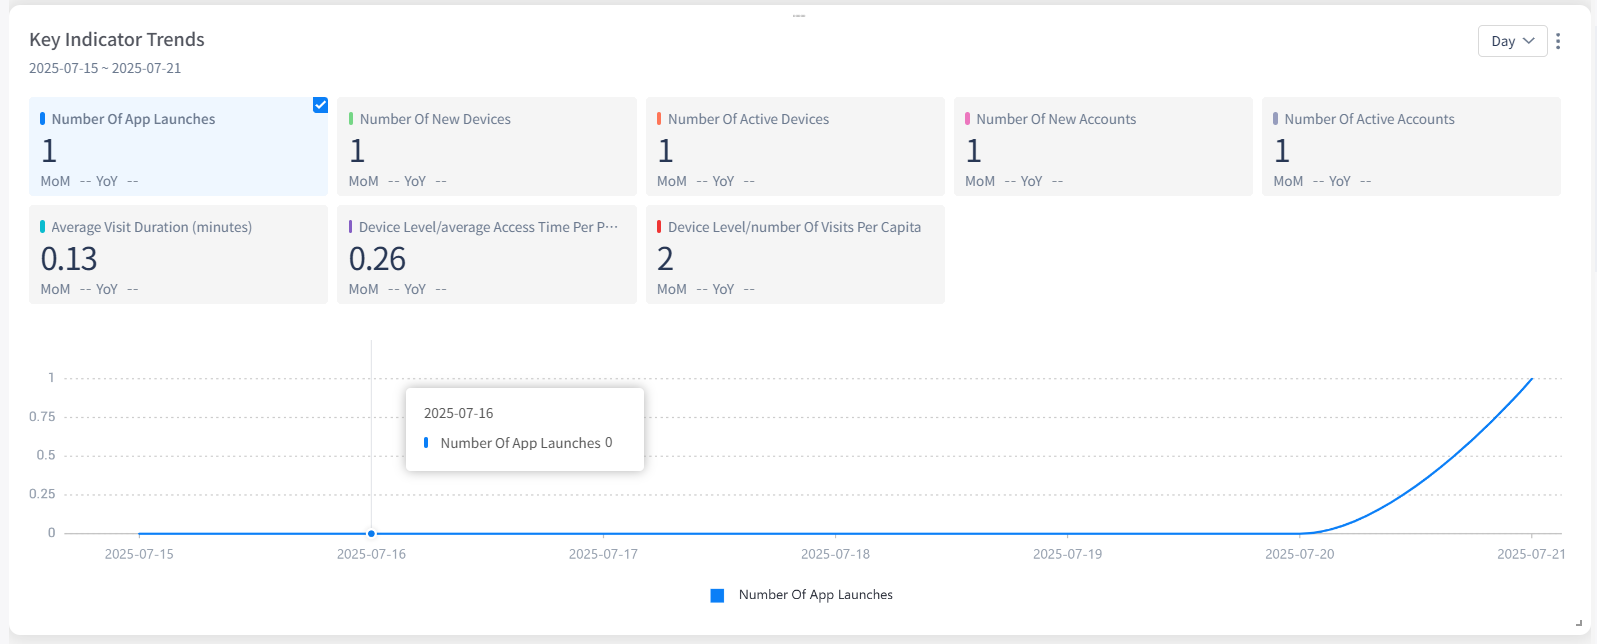
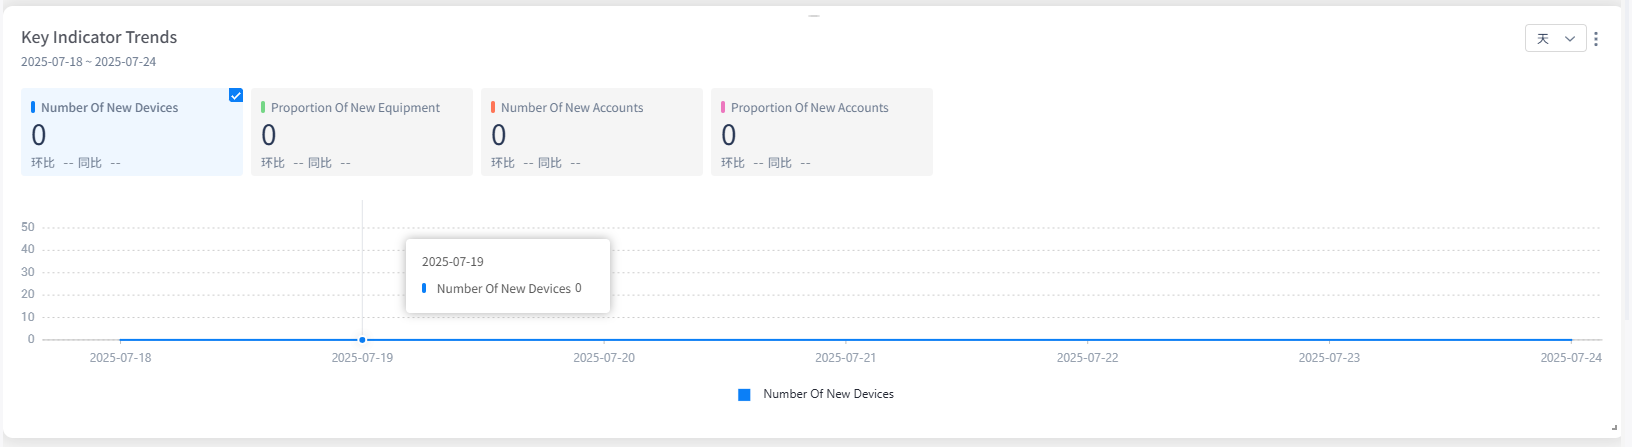
4. Key Indicator Trends
Number of Active Devices: The number of device IDs that triggered the app launch during the selected time.
Number of New Accounts: The number of device IDs that trigger any event during the selected time, and the system property device is started for the first day.
Number of Active Accounts: the number of Deduplication of the device IDs that triggered any event within a specified period of time.
Number of New Devices: the number of account IDs that trigger any event within the selected time, and the system attribute account logs on the first day.
Number of App Launches: the number of account IDs that trigger an event within a specified period of time.
Average Visit Duration(minutes): the average duration of the application Exit within the selected time /the duration of 60 minutes.
Device Level/average Access Time Per: the cumulative value of the application Exit duration /the number of deduplication times of the device IDs that the application exits during the selected period. The duration is greater than 0/60 minutes.
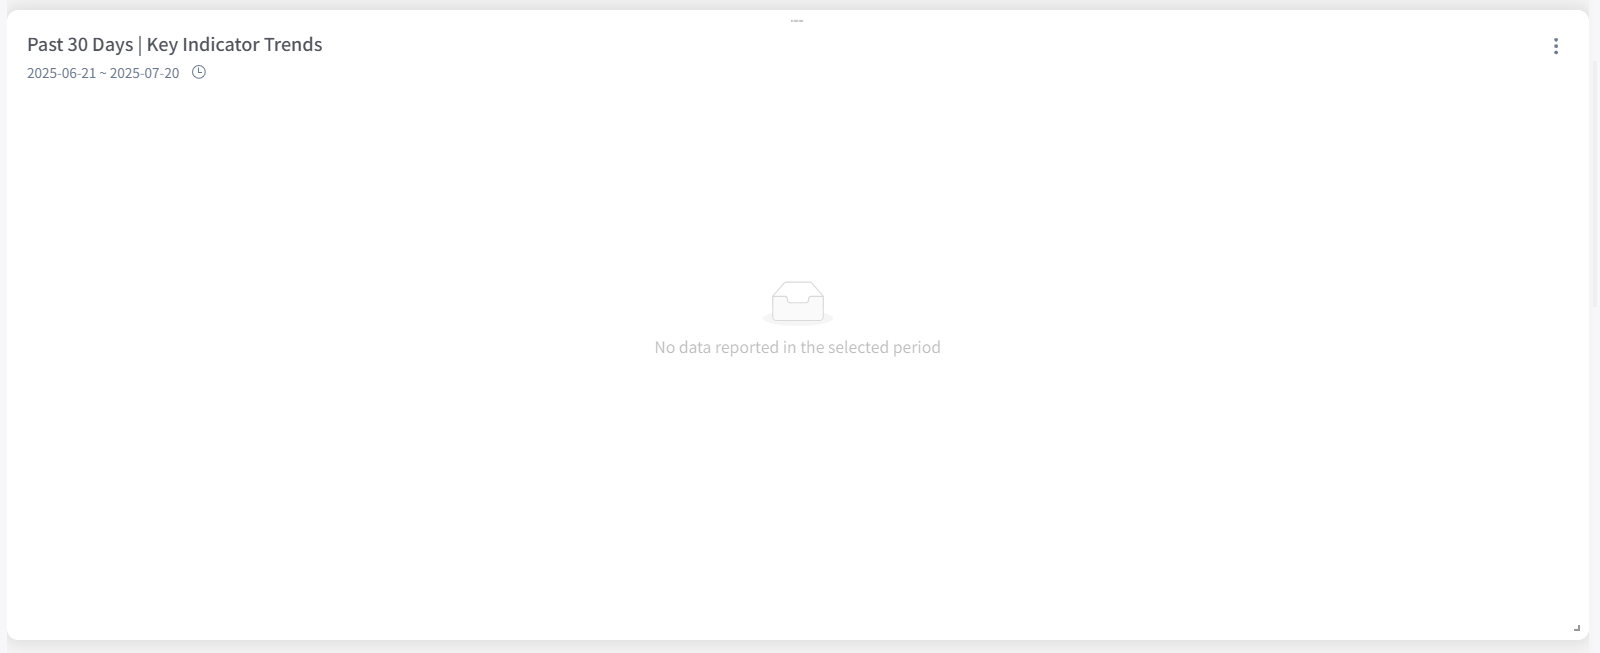
5. Past 30 Days | Key Indicator Trends
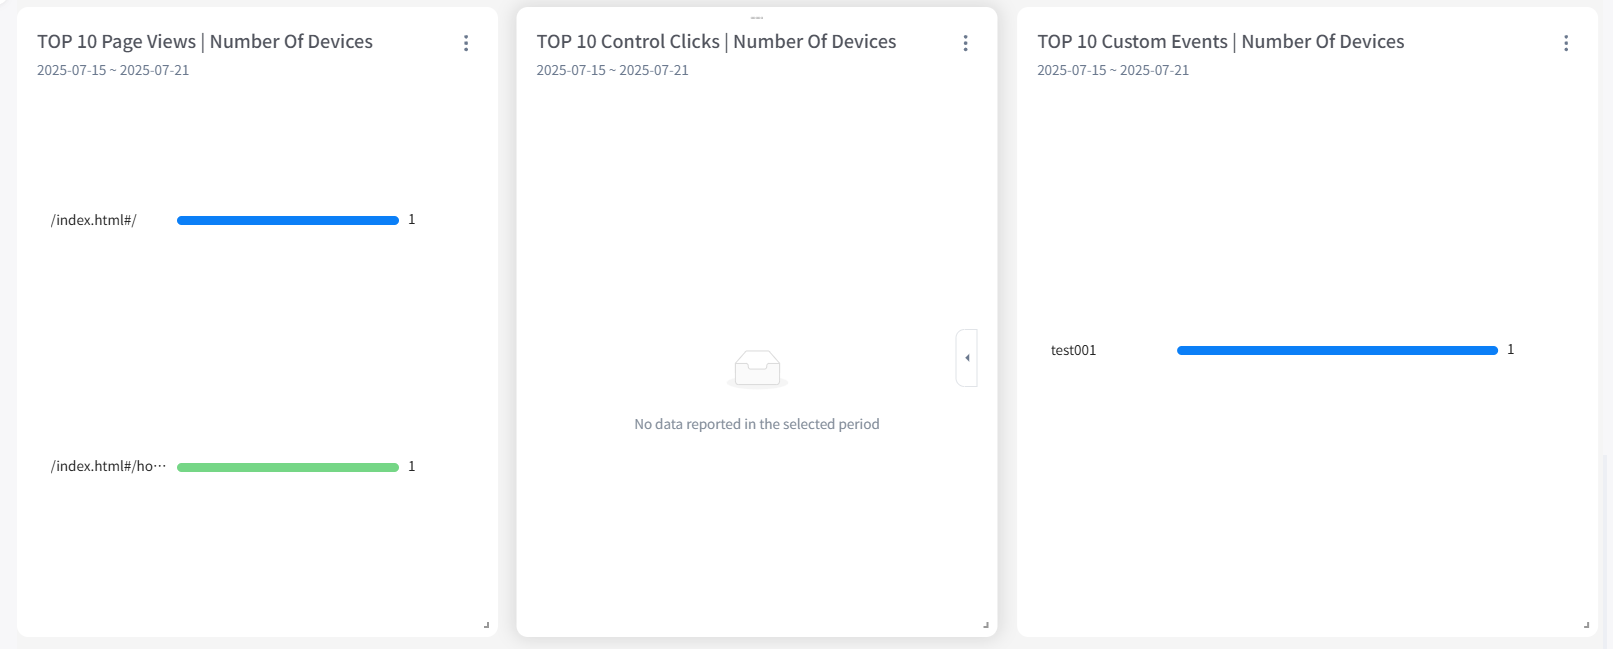
6. TOP 10 Page Views | Number of Devices
Event Code: the page browsing event triggered by the user within the selected time. The display logic displays the event name as the event name. If no event name is entered, the event code is displayed as the event code.
Devices: The number of devices that triggered the page browsing event during the selected time.
7. TOP 10 Control Clicks | Number of Devices
Control Name: the event code of the control click type that is triggered within the selected time. The display logic displays the event name as the event name entered. If no event name is entered, the event code is displayed as the event code.
Number of devices: The number of devices that triggered the control click event during the selected time.
8. TOP 10 Custom Events | Number of Devices
Event Code: the event code that triggers an event whose Event Type is equal to the custom event within the specified time range. The event name is displayed in the display logic. If you do not enter an event name, the event code is displayed.
Devices: the number of devices that triggered the custom event during the selected time.
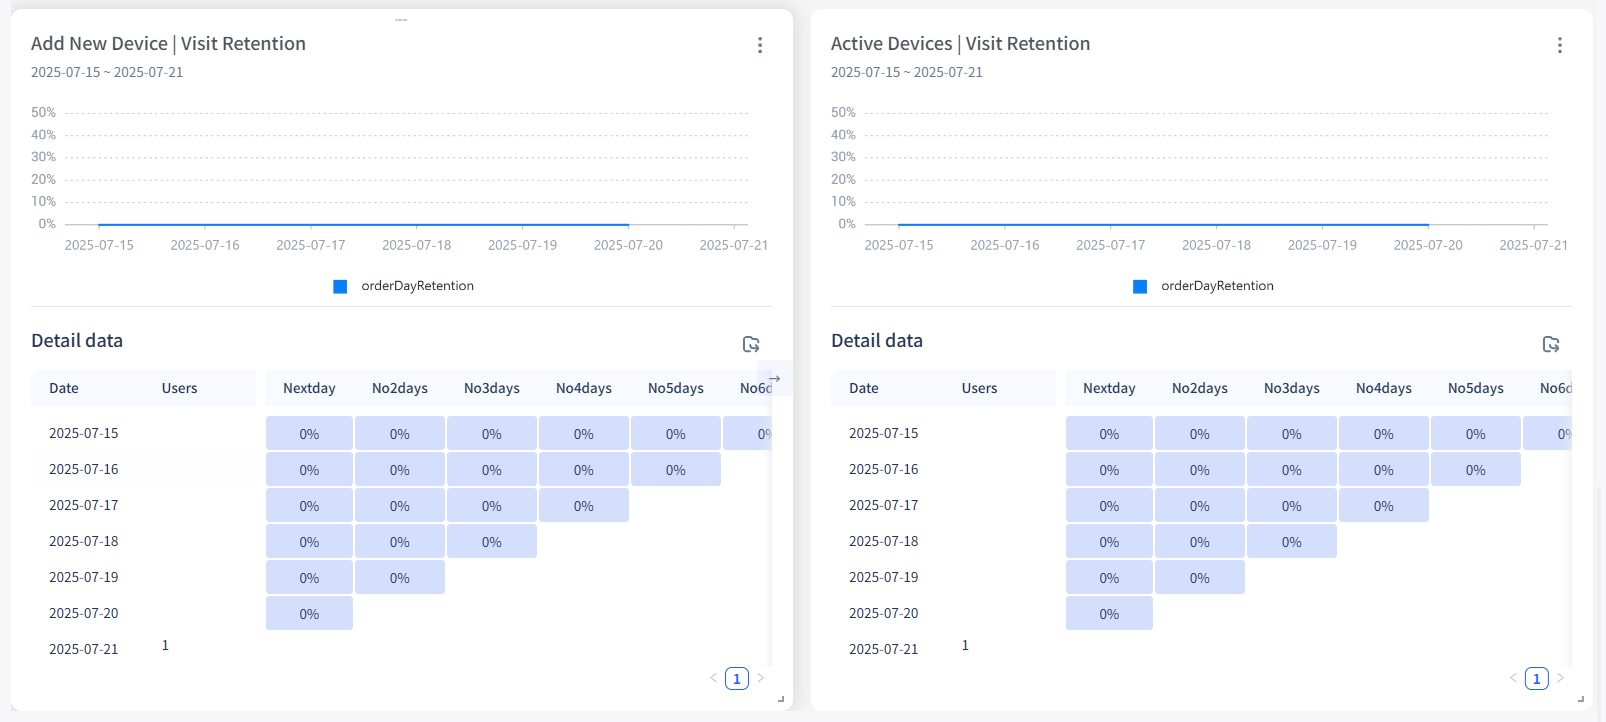
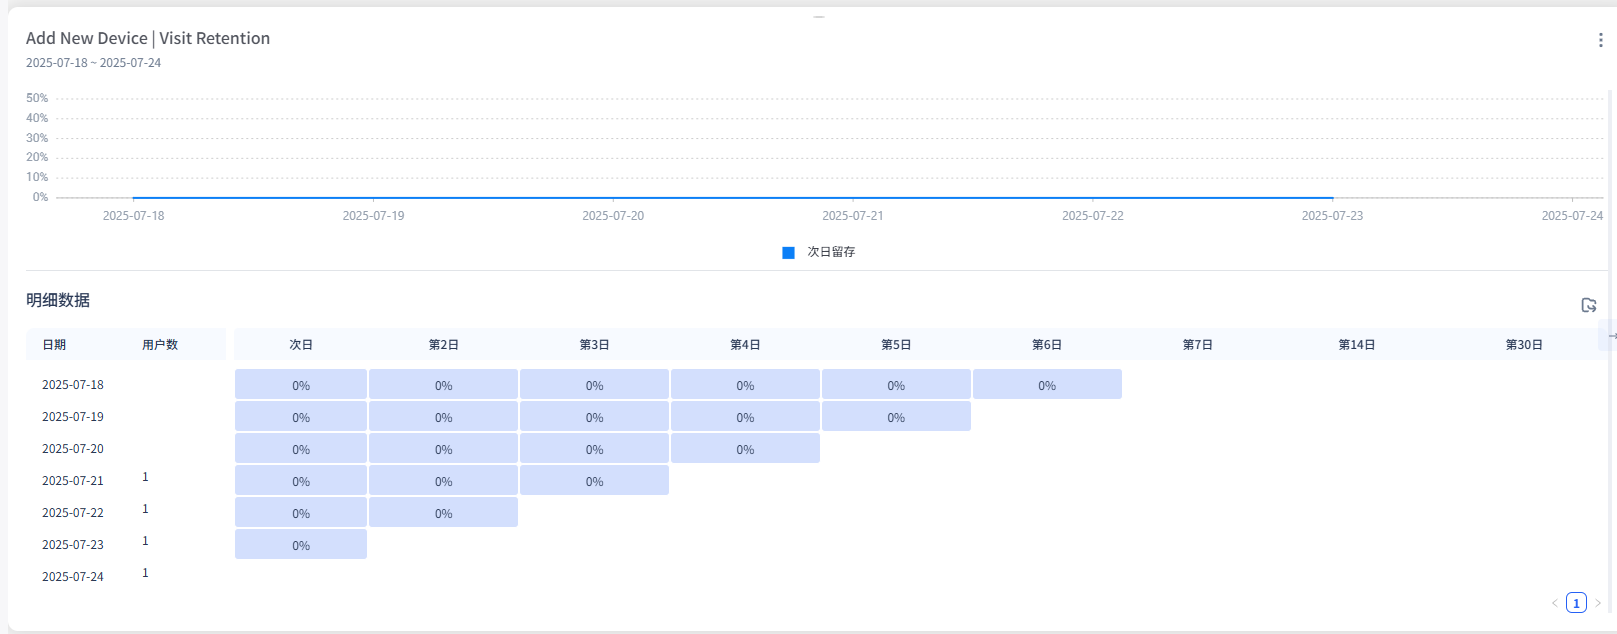
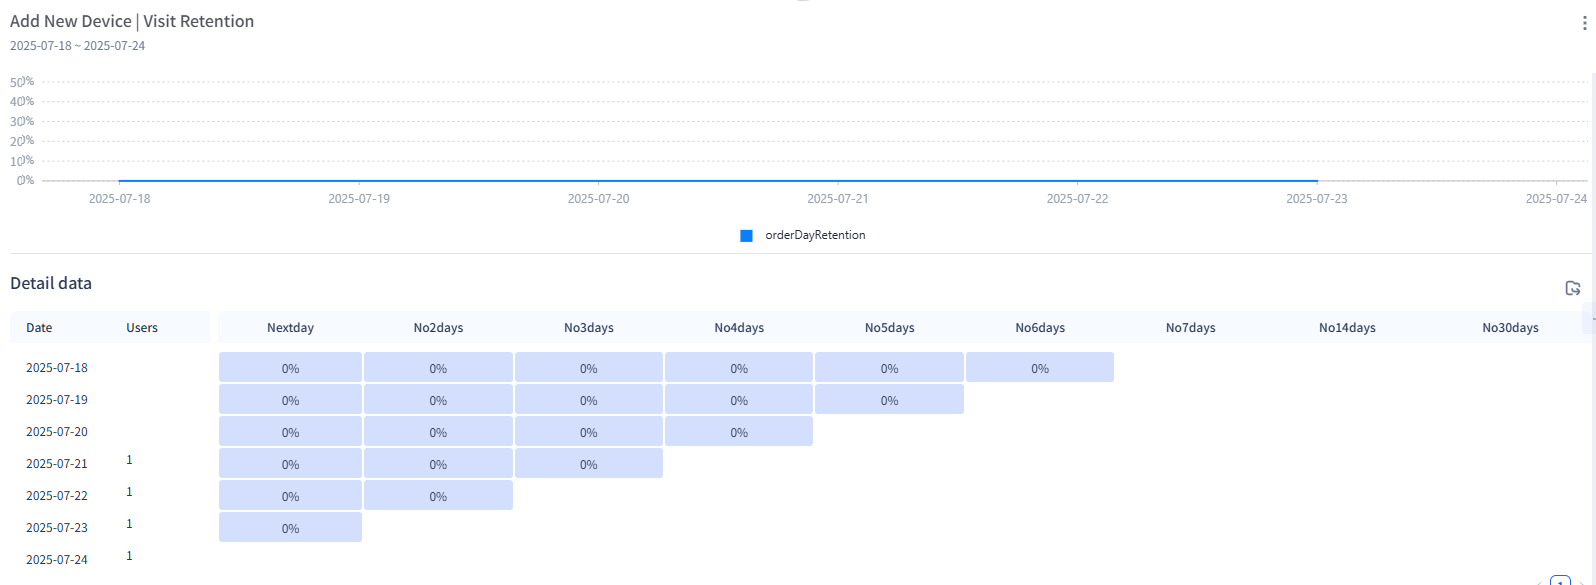
9. Add New Device | Visit Retention
Analysis body: device ID
Access retention: triggers Initial Behavior Events and Subsequent Behavior Events within a specified period of time.
New devices: On day T (week or month), the number of devices that have triggered the app launch for the first time in history.
Retention rate: new users on day t, number of active users on day t + n (week or month) /number of new users on day t (week or month) * 100%.
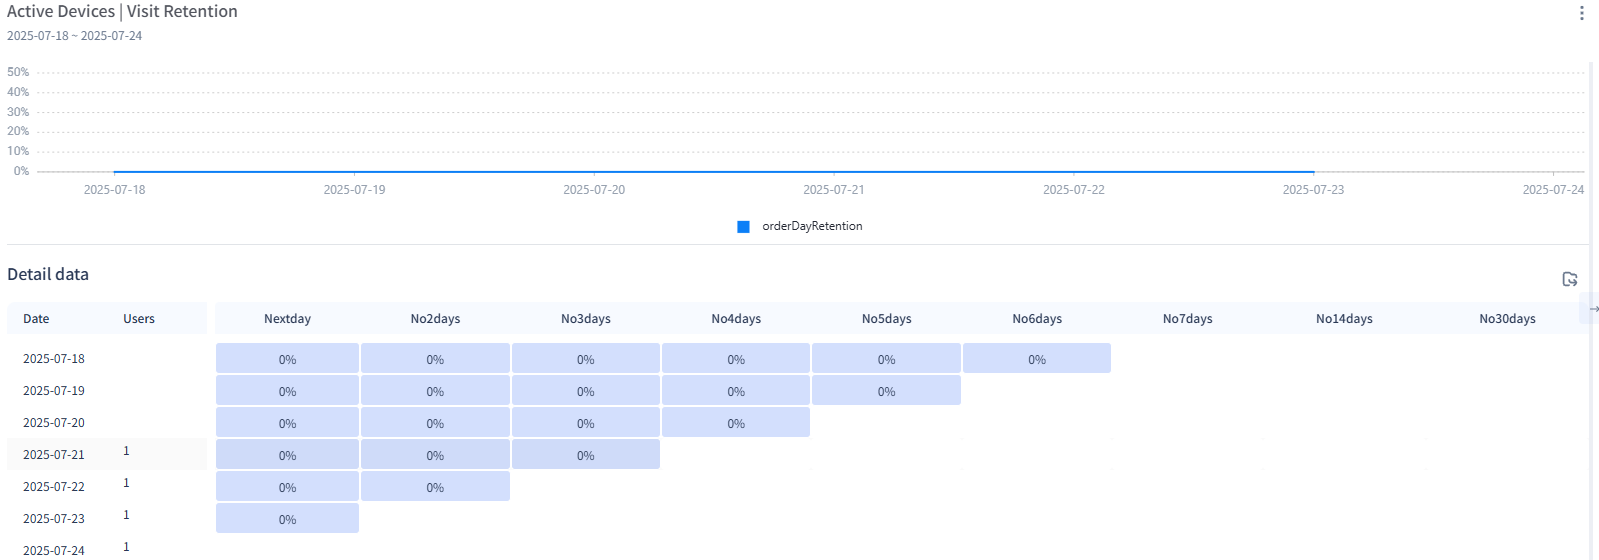
10. Active Devices | Visit Retention
Active devices: the number of devices that have triggered the app startup event on the Tth day (week or month).
Retention rate: Number of active users on day T and active again on day T + N (week or month) /Number of active users on day T * 100%.
Through the two reports of active user retention and new user retention, you can quickly know the overall user stickiness of the application and the quality of new users.
Time-sharing Insights
The Time-sharing Insights includes 4 reports: New and Active Trends, Number of Key Actions, New And Old Equipment | Comparison of Active Trends, TOP 10 Behavioral Events | Number of Devices, through which users and App indicators can be gained.
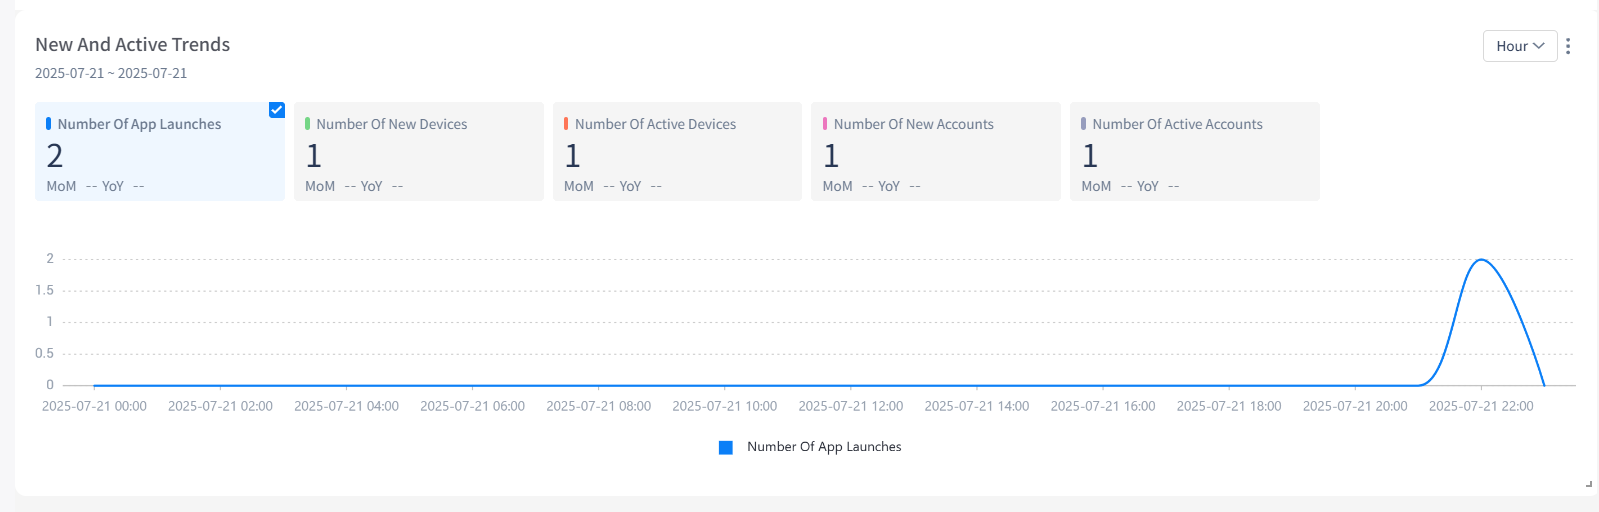
1. New And Active Trends
Number of New Devices: The number of device IDs that triggered the app launch during the selected time.
Number of New Accounts: The number of device IDs that trigger any event during the selected time, and the system property device is started for the first day.
Number of Active Accounts: the number of deduplication of the device IDs that triggered any event within a specified period of time.
Number of Active Devices: the number of account IDs that trigger any event within the selected time, and the system attribute account logs on on the first day.
Number of App Launches: the number of account IDs that trigger an event within a specified period of time.
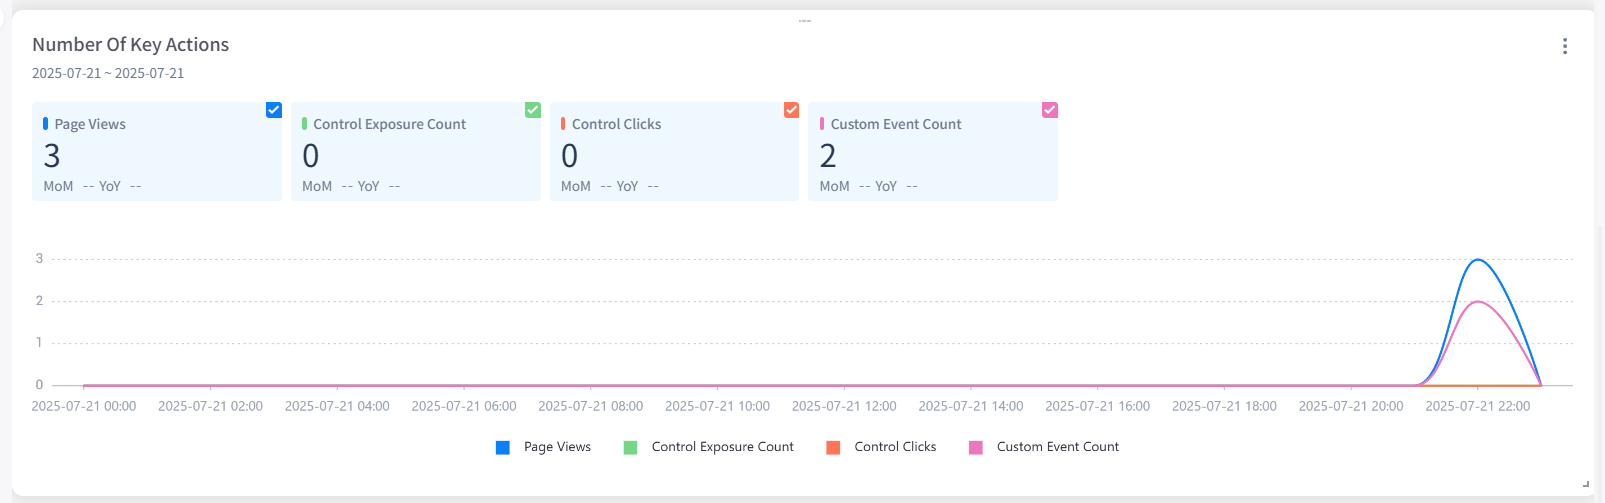
2. Number of Key Actions
Page Views: The number of device IDs that triggered the pageview event during the selected time.
Control Exposure Count: The number of device IDs that triggered the page control exposure event during the selected time.
Control Clicks: The number of device IDs that triggered the control click event during the selected time.
Custom Event Count: Number of device IDs that fired any event and the system property Event Type was equal to the custom event during the selected time.
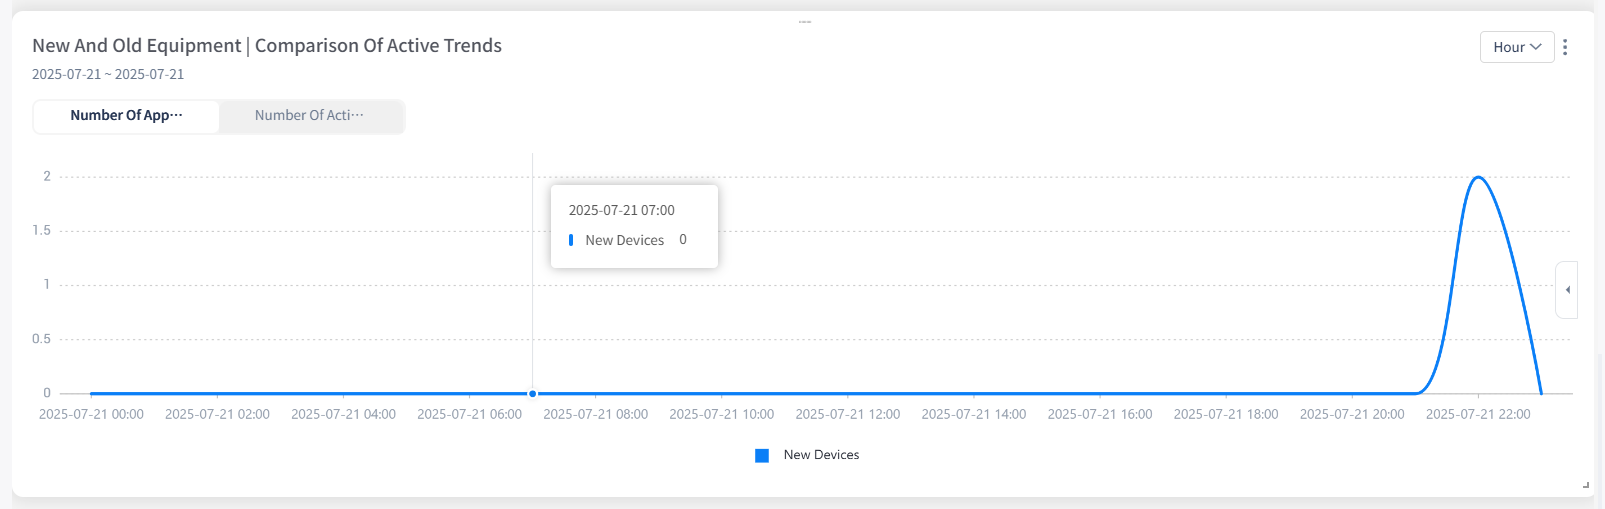
3. New And Old Equipment | Comparison of Active Trends
Number of App Launches: The number of device IDs that triggered the app launch event during the selected time.
Number of Active Devices: The number of device IDs that triggered any event during the selected time.
Number of new devices: During the selected time, the application startup event is triggered and the device starts on the first day.
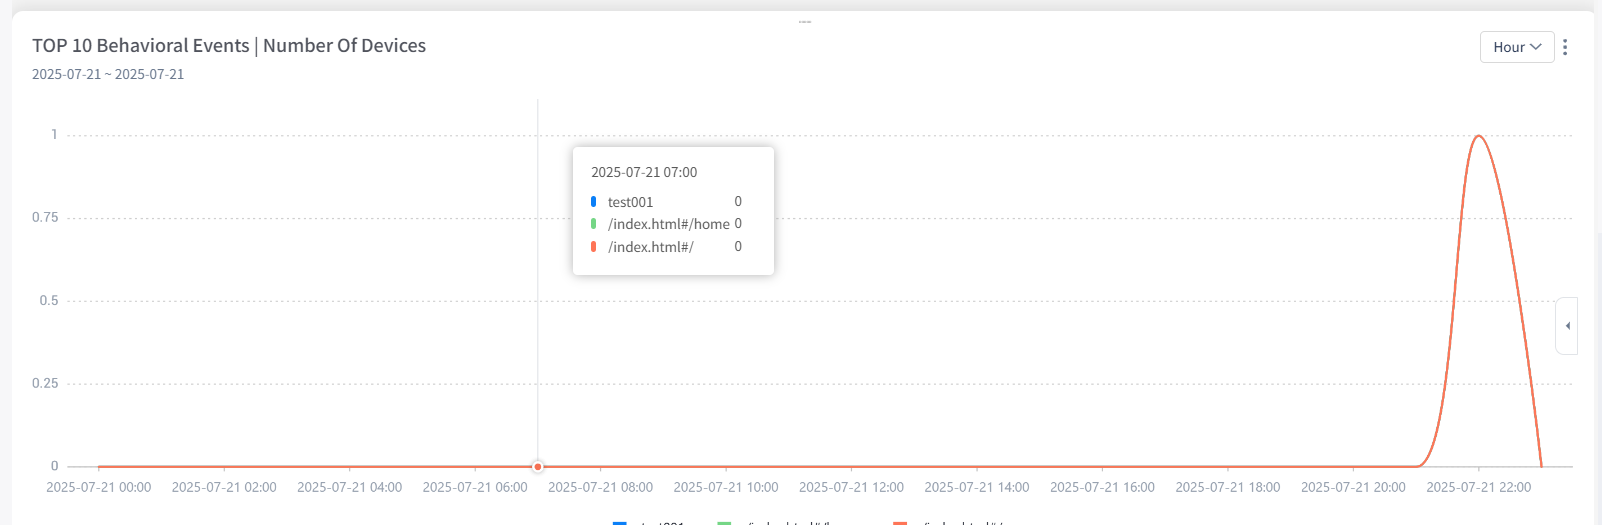
4. TOP 10 Behavioral Events | Number of Devices
Event Code: any system Preset event triggered by the user within the selected time. The display logic displays the event name as the event name entered. If the event name is not entered, the event code is displayed.
Devices: The number of devices that triggered the pageview event during the selected time.
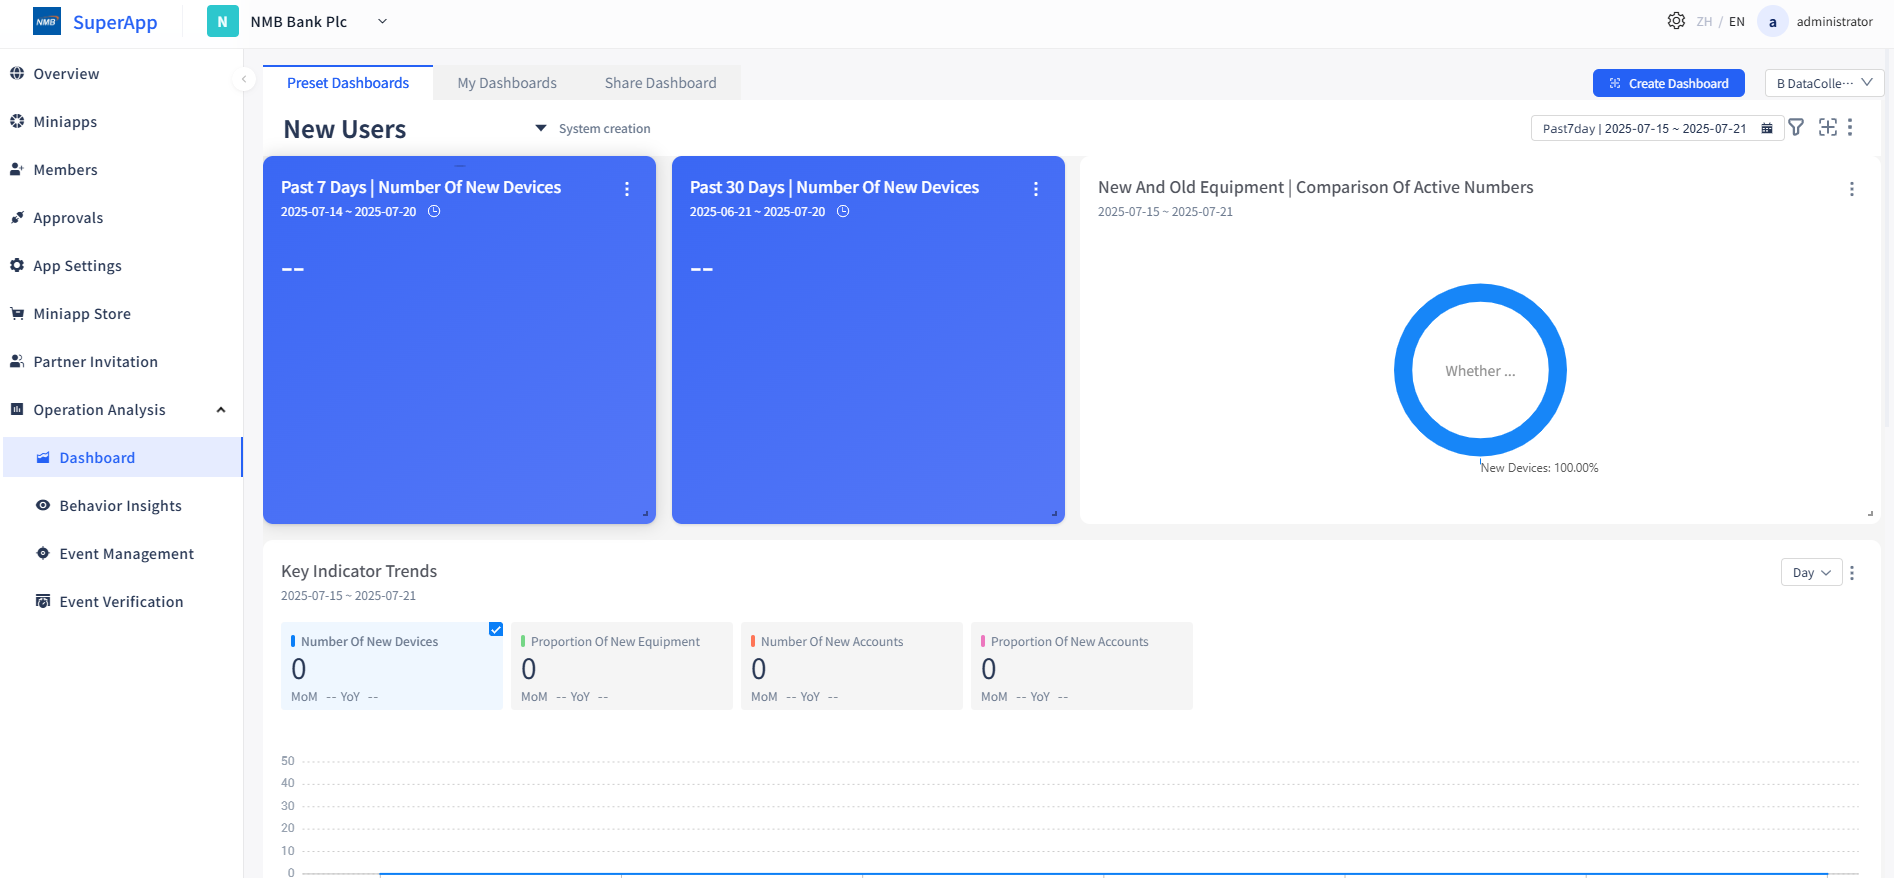
New Users
A new user dashboard includes eight reports: Past 7 Days | Number of New Devices, Past 30 Days | Number of New Devices, New And Old Equipment | Comparison of Active Numbers, Key Indicator Trends, Add New Device | Visit Retention, TOP 10 Page Views | Number of New Devices, TOP 10 Control Clicks | Number of New Devices, and TOP 10 Custom Events | Number of New Devices. This dashboard allows you to quickly learn about new user trends and popular behavior data.
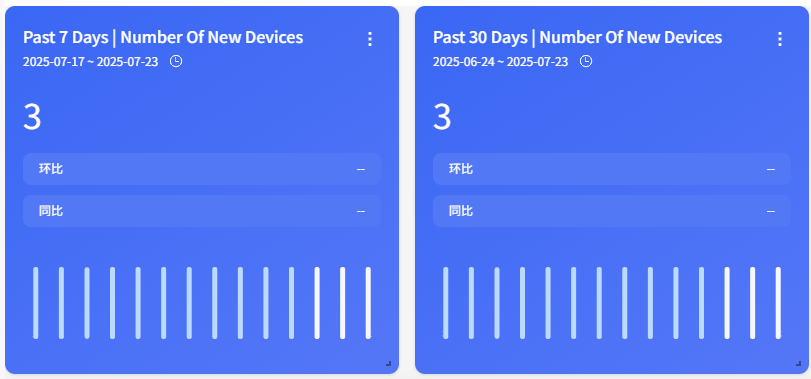
1. Past 7 Days /30 Days| Number of New Devices
The number of Deduplication of device IDs that triggered any event in the past 7/30 days, and the system property device started on the first day.
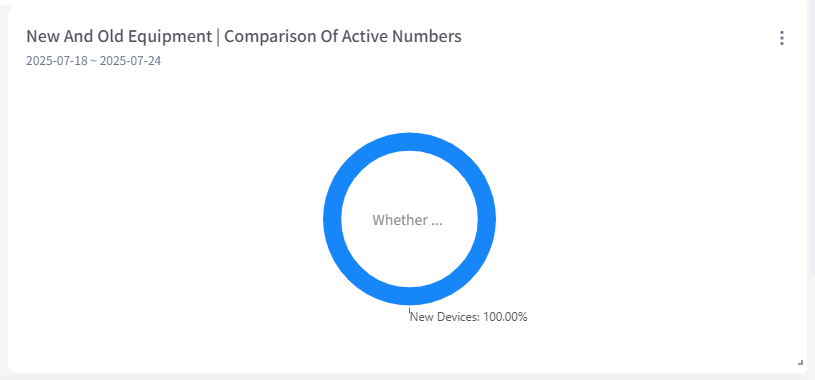
2. New And Old Equipment | Comparison of Active Numbers
3. Key Indicator Trends
4. Add New Device | Visit Retention
Install Channel: The property value of the first install channel of the system property within the selected time
Number of new devices: the number of deduplication of device IDs that triggered the application start event within the selected time, and the system property device started on the first day.
5. TOP 10 Page Views | Number of New Devices
Event Code: Any system Preset event triggered by the user within the selected time. The display logic displays the event name by entering the event name. If no event name is entered, the event code is displayed.
Number of new devices for page browsing: the number of Deduplication of device IDs that triggered the page exhibition within the selected time and the device started on the first day.
6. TOP 10 Control Clicks | Number of New Devices
Control Event Code: Any system Preset event triggered by the user within the selected time. The display logic displays the event name by entering the event name. If no event name is entered, the event code is displayed.
Number of new devices: the number of Deduplication of the device ID that triggered the control click event within the selected time, and the device started on the first day.
7. TOP 10 Custom Events | Number of New Devices
Event Code: the event code that triggers an event whose Event Type is equal to the custom event within the specified time range. The event name is displayed in the display logic. If you do not enter an event name, the event code is displayed.
Number of new devices: the number of Deduplication of the device ID that triggered the custom event within the selected time and the device started on the first day.

Active Users
Added 10 reports: Last 7 Days | Number Of Active Devices, Past 7 Days | Number Of Active Accounts, Last 30 Days | Number Of Active Devices, Past 30 Days | Number Of Active Accounts, Key Indicators Of Active Users, Past 30 Days | Analysis Of Key Indicators Of Active Users, Distribution Of Visit Days | Number Of Active Devices, Landing Page Distribution | Number Of Application Launch Devices, Scene Source | Number Of Active Devices, Scene Source | User Activity Details.
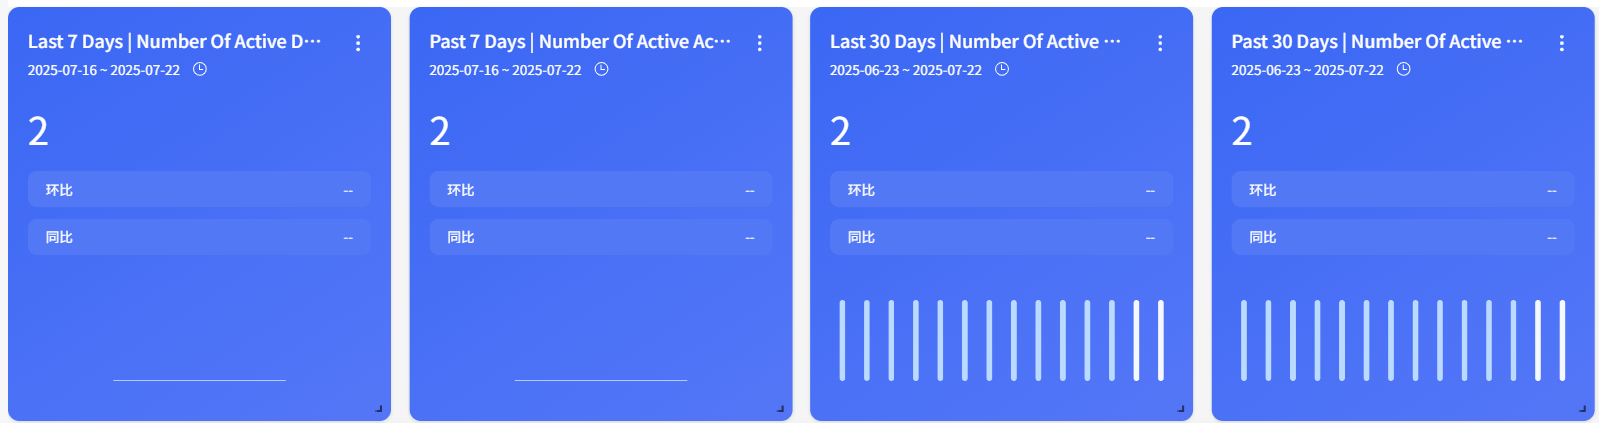
1. Last 7 Days /30 Days| Number of Active Devices/Accounts
The number of active devices in the last seven days.
Active Devices: the number of Deduplication of device IDs that triggered any event in the past 7/30 days.
Active Accounts: the number of account IDs that triggered any event in the last 7/30 days.
The same-period comparison calculation rule: Ring period indicator value-previous period indicator /previous period indicator value; year-on-year = (number of current periods-number of the same period) /number of the same period.
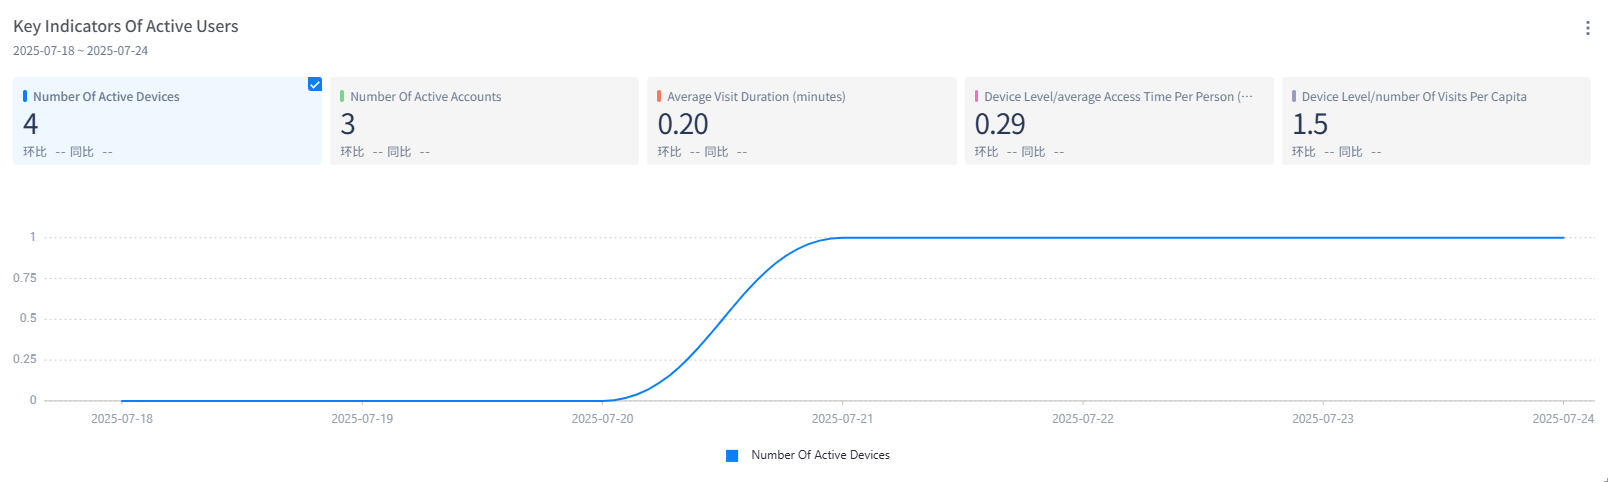
2. Key Indicators of Active Users
Number Of Active Devices: The number of Deduplication of device IDs that triggered any event in the past 30 days.
Number Of Active Accounts: The number of account IDs that triggered any event in the last 30 days.
Average Visit Duration(minutes): the average number of times the application was withdrawn /the duration of 60 minutes in the past 30 days.
Device Level /average Access Time Per Person(minutes): the cumulative value of the application withdrawal duration /the number of deduplication times of the device IDs that the application was withdrawn from within the last 30 days. The duration is greater than 0/60.
Device Level/number of Visits Per Capita: The per capita number of device IDs that have been started by the app in the last 30 days.
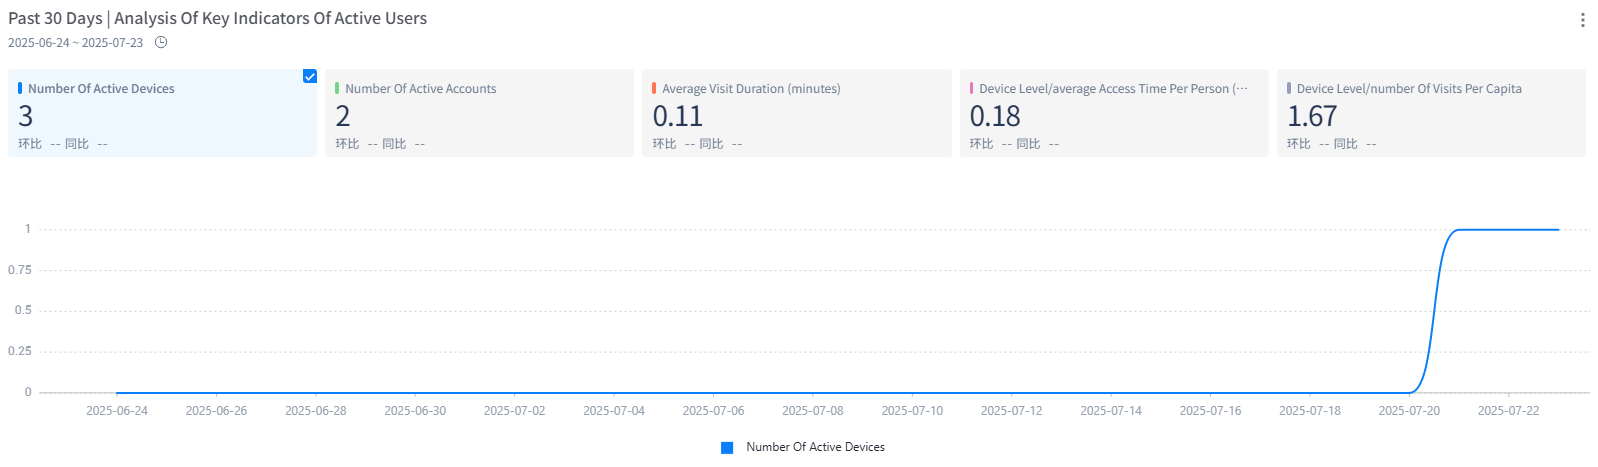
3. Past 30 Days | Analysis of Key Indicators of Active Users
Number Of Active Devices: The number of deduplication of device IDs that triggered any event in the past 30 days.
Number Of Active Accounts: The number of account IDs that triggered any event in the last 30 days.
Average Visit Duration(minutes): the average number of times the application was withdrawn /the duration of 60 minutes in the past 30 days.
Device Level/average Access Time Per Person(minutes): the cumulative value of the application withdrawal duration /the number of deduplication times of the device IDs that the application was withdrawn from within the last 30 days. The duration is greater than 0/60.
DeviceLevel/number of VisitsPer Capita: The per capita number of device IDs that have been started by the app in the last 30 days.
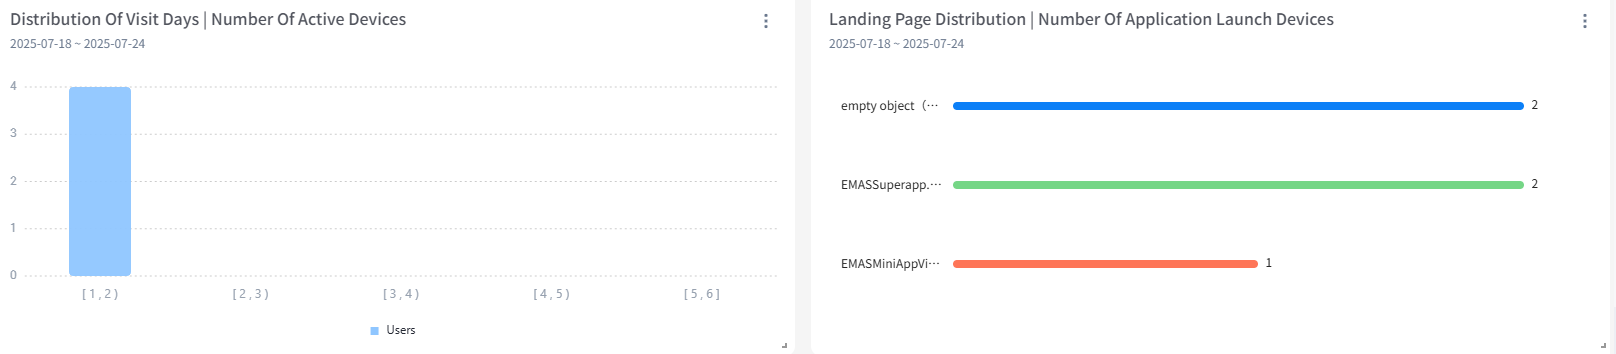
4. Distribution of Visit Days | Number of Active Devices
Access days distribution: the distribution of days that trigger any event within the selected time.
Number of active devices: the number of active devices that trigger any event within the selected time.
4.4.5. Landing Page Distribution | Number of Application Launch Devices
Indicates the page (that is, the landing page) that a user enters when opening an application or applet for the first time, and the number of startup devices corresponding to each page.
6. Scene Source | Number of Active Devices
Indicates the number of devices that generate active behavior after users enter applications or applets from different "scenario sources.
7. Scene Source | User Activity Details
It not only counts the number of active devices from different scenarios, but also further analyzes the specific behavior data of users in these scenarios, such as page access, duration of stay, click behavior, conversion rate, etc.
Retained Users
Add user Dashboard, including two reports: Add New Device | Visit Retention, Active Devices | Visit Retention. You can view the Retention analysis of New and Active users by using retained users.
1. Add New Device | Visit Retention
Analysis subject: Device ID
Access retention: triggers the initial behavior "any event" and subsequent behavior "any event" within the selected time 」
New devices: the number of devices that triggered APP startup for the first time in history on the T th Day (week or month).
Retention rate: new users on day T, active users on day T + N (week or month)/new users on day T (week or month) * 100%.
2. Active Devices | Visit Retention
● jump device: the number of devices that have triggered the APP startup event on day T (week or month).
● retention rate: the number of active users on day T + N (week or month) or the number of active users on day T * 100%.