Applications deployed in Container Service for Kubernetes (ACK) clusters and instrumented with the OpenTelemetry SDK generate metrics, traces, and logs. By deploying an OpenTelemetry Collector as a sidecar, you can convert these signals -- including native OTel metrics, custom business metrics, and metrics derived from trace spans -- into Prometheus format and write them to Managed Service for Prometheus. Converting trace data into metrics reduces data ingestion volume while preserving key performance indicators.
How it works
OpenTelemetry Collector is an extensible data processing pipeline that receives telemetry data from applications via OpenTelemetry Protocol (OTLP) or other protocols (such as the native Prometheus protocol), processes it, and exports it in the format required by the target system. Because OTel metrics are compatible with Prometheus, the Collector can convert them to Prometheus format for storage in Managed Service for Prometheus.
Choose an export mode
The Collector supports two exporters for converting OTel metrics to Prometheus format:
| Feature | Prometheus exporter | Prometheus remote write exporter |
|---|---|---|
| How it works | Exposes a /metrics endpoint that the Prometheus agent scrapes | Pushes metrics directly to the Managed Service for Prometheus endpoint via the remote write protocol |
| Authentication | Handled by the Prometheus agent; no write-path authentication required in the Collector | Requires endpoint URL and credentials (password-free VPC policy or AccessKey pair) |
| Configuration complexity | Lower -- add a PodMonitor to configure scraping | Higher -- configure the remote write endpoint and authentication in the Collector |
| Best for | Standard workloads with stable metric collection | Large data volumes or scenarios with unstable scraping |
| Collection interval control | Adjustable through PodMonitor interval setting | Controlled by the Collector's flush interval |
Data type conversion
Both exporters perform the same OTel-to-Prometheus data type conversion:
| OTel metric type | Prometheus metric type | Notes |
|---|---|---|
gauge | gauge | Direct mapping |
sum | counter or gauge | Based on the Monotonic property |
histogram | histogram | Through bucket and sum sub-metrics |
Metric names are mapped to Prometheus-compatible format, and labels are preserved or renamed to comply with Prometheus naming rules.
Prerequisites
Before you begin, make sure you have:
An ACK cluster with applications instrumented using the OpenTelemetry SDK
A Managed Service for Prometheus instance associated with your cluster (see Step 1)
Step 1: Prepare Managed Service for Prometheus
Cluster with Prometheus monitoring enabled
If Prometheus monitoring is already enabled for your ACK cluster, the Prometheus instance exists. To find it:
Log on to the CloudMonitor console.
In the left-side navigation pane, choose Managed Service for Prometheus > Instances.
Locate the Prometheus instance with the same name as your ACK cluster.

Cluster without Prometheus monitoring enabled
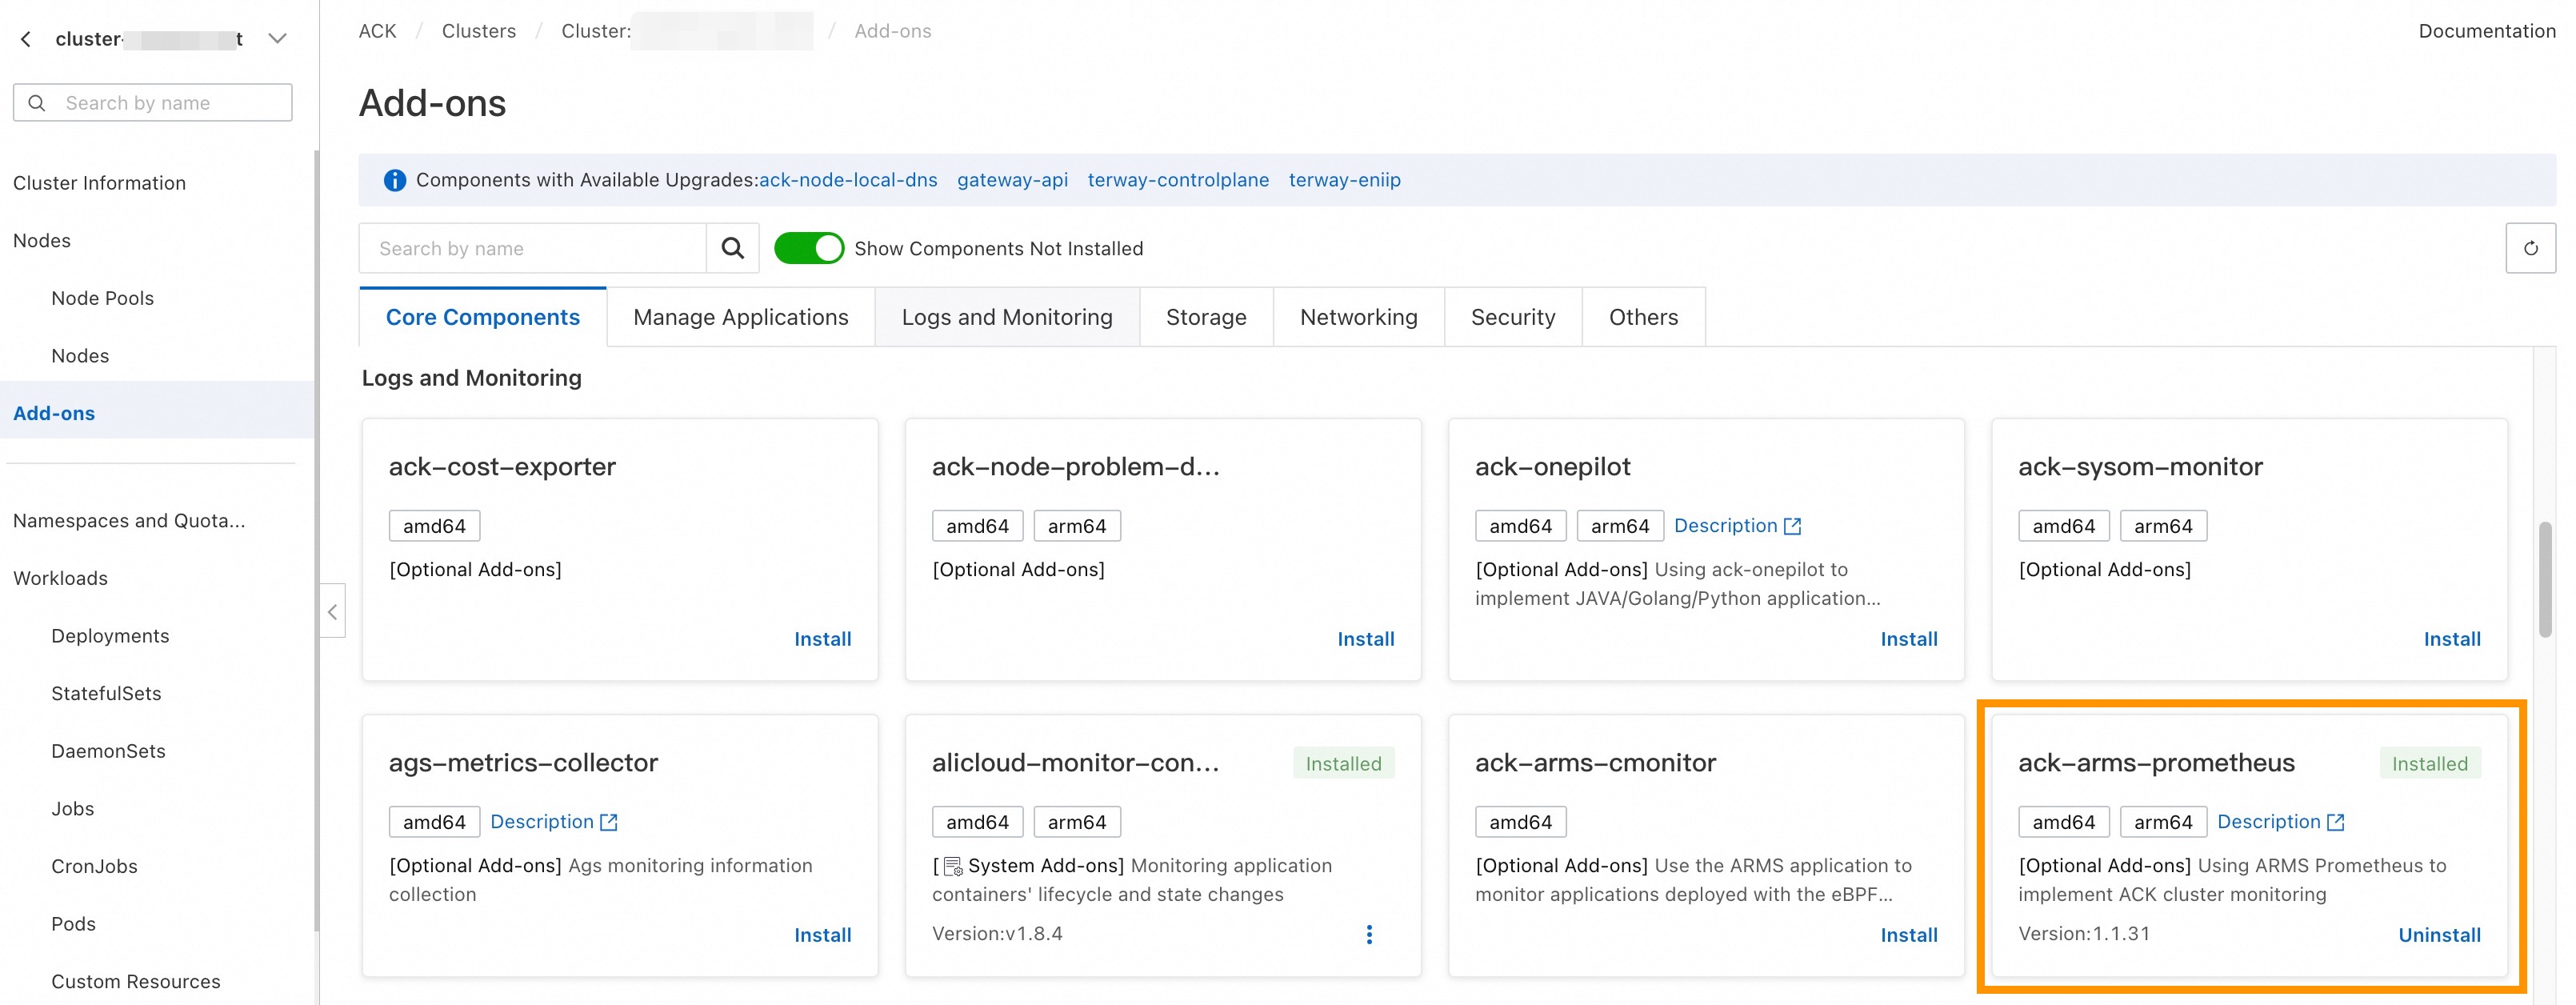
Log on to the ACK console.
Click your cluster name, then go to the Add-ons page.
Install the
ack-arms-prometheuscomponent. This automatically enables Prometheus monitoring for the cluster.
Step 2: Deploy the Collector in sidecar mode
Deploy the Collector as a sidecar container so that metrics and traces from the same pod reach the same Collector instance. This is required for accurate metric statistical calculations. The Gateway deployment mode requires handling load balancing, which adds complexity.
Configure the Collector's resource limits (CPU and memory) based on your application's request volume to make sure the Collector can process all incoming data.
The following Kubernetes Deployment manifest adds an OpenTelemetry Collector sidecar alongside your application container:
# Kubernetes Deployment example
apiVersion: apps/v1
kind: Deployment
spec:
  template:
    metadata:
      labels:
        # Add a label to the pod for metric collection targeting
        observability: opentelemetry-collector
    spec:
      volumes:
      - name: otel-config-volume
        configMap:
          # References the Collector ConfigMap created below
          name: otel-config
      containers:
        - name: app
          image: your-app:latest
          env:
            - name: OTEL_EXPORTER_OTLP_ENDPOINT
              value: http://localhost:4317
        - name: otel-collector
          # Replace <regionId> with your actual region ID
          image: registry-<regionId>.ack.aliyuncs.com/acs/otel-collector:v0.128.0-7436f91
          args: ["--config=/etc/otel/config/otel-config.yaml"]
          ports:
            - containerPort: 1234  # Prometheus endpoint
              name: metrics
          volumeMounts:
          - name: otel-config-volume
            mountPath: /etc/otel/config
Replace <regionId> with your region ID (for example, cn-hangzhou).
This Deployment configuration applies to both export modes. The difference lies in the Collector configuration (ConfigMap), which is covered in the following sections.
Step 3: Configure the Collector
Option A: Prometheus exporter mode
This mode does not require you to handle Prometheus write-path authentication. Adjust the metric collection interval by modifying the PodMonitor configuration.
Architecture

Collector ConfigMap
apiVersion: v1
kind: ConfigMap
metadata:
  name: otel-config
  namespace: <app-namespace>
data:
  otel-config.yaml: |
    extensions:
      zpages:
        endpoint: localhost:55679

    receivers:
      otlp:
        protocols:
          grpc:
            endpoint: 0.0.0.0:4317
          http:
            endpoint: 0.0.0.0:4318

    processors:
      batch:
      memory_limiter:
        # 75% of maximum memory up to 2G
        limit_mib: 1536
        # 25% of limit up to 2G
        spike_limit_mib: 512
        check_interval: 5s
      resource:
        attributes:
          - key: process.runtime.description
            action: delete
          - key: process.command_args
            action: delete
          - key: telemetry.distro.version
            action: delete
          - key: telemetry.sdk.name
            action: delete
          - key: telemetry.sdk.version
            action: delete
          - key: service.instance.id
            action: delete
          - key: process.runtime.name
            action: delete
          - key: process.runtime.description
            action: delete
          - key: process.pid
            action: delete
          - key: process.executable.path
            action: delete
          - key: process.command.args
            action: delete
          - key: os.description
            action: delete
          - key: instance
            action: delete
          - key: container.id
            action: delete

    connectors:
      spanmetrics:
        histogram:
          explicit:
            buckets: [0.001, 0.005, 0.01, 0.05, 0.1, 0.5, 1, 5, 10]
        dimensions:
          - name: http.method
            default: "GET"
          - name: http.response.status_code
          - name: http.route
            # Custom attribute
          - name: user.id
        metrics_flush_interval: 15s
        exclude_dimensions:
        metrics_expiration: 3m
        events:
          enabled: true
          dimensions:
          - name: default
            default: "GET"


    exporters:
      debug:
        verbosity: detailed
      prometheus:
        endpoint: "0.0.0.0:1234"
        namespace: "acs"
        const_labels:
          label1: value1
        send_timestamps: true
        metric_expiration: 5m
        enable_open_metrics: true
        add_metric_suffixes: false
        resource_to_telemetry_conversion:
          enabled: true


    service:
      pipelines:
        logs:
          receivers: [otlp]
          exporters: [debug]
        traces:
          receivers: [otlp]
          processors: [resource]
          exporters: [spanmetrics]
        metrics:
          receivers: [otlp]
          processors: [memory_limiter, batch]
          exporters: [prometheus]
        metrics/2:
          receivers: [spanmetrics]
          exporters: [prometheus]

      extensions: [zpages]
This configuration does the following:
Receives metrics and traces over OTLP (gRPC on port 4317, HTTP on port 4318).
Processes incoming data using
memory_limiterandbatchprocessors. Theresourceprocessor strips environment attributes (such asprocess.pidandos.description) that typically generate excessive metric cardinality.Converts trace spans into metrics using the
spanmetricsconnector, which produces histogram and counter metrics from span data.Exports all metrics through the Prometheus exporter on port 1234.
PodMonitor configuration
Create a PodMonitor resource so that the Prometheus agent scrapes metrics from the Collector sidecar:
apiVersion: monitoring.coreos.com/v1
kind: PodMonitor
metadata:
  name: opentelemetry-collector-podmonitor
  namespace: default
  annotations:
    arms.prometheus.io/discovery: "true"
spec:
  selector:
    matchLabels:
      observability: opentelemetry-collector
  podMetricsEndpoints:
  - port: metrics
    interval: 15s
    scheme: http
    path: /metrics
Option B: Prometheus remote write exporter mode
This mode is suitable for large data volumes or unstable scraping scenarios, where the Collector writes directly to the Prometheus instance. It requires configuring the write-path endpoint and authentication.
Architecture

Get the remote write endpoint
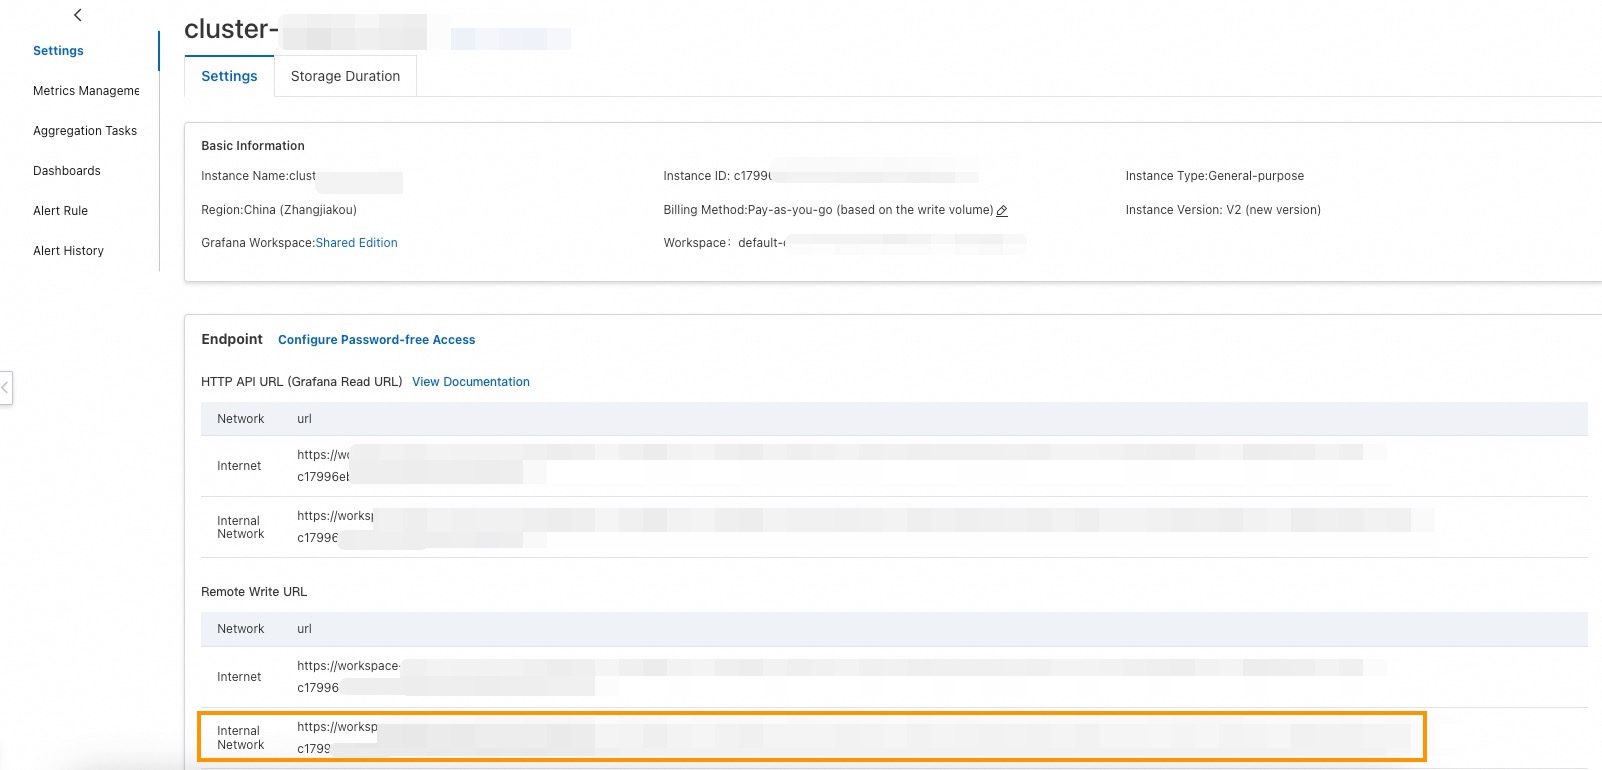
Log on to the CloudMonitor console.
In the left-side navigation pane, choose Managed Service for Prometheus > Instances.
Find the Prometheus instance that corresponds to your cluster. In most cases, the Prometheus instance ID matches the ACK cluster ID.
Click the instance name. On the Settings page, locate the Remote Write URL and copy the internal network address.
Configure authentication
Choose one of the following authentication methods:
Password-free policy (V2 instances only): V2 Managed Service for Prometheus instances support password-free writing from within the cluster's virtual private cloud (VPC). No additional credential configuration is required.
AccessKey pair authentication: Create a Resource Access Management (RAM) user, attach the
AliyunPrometheusMetricWriteAccesssystem policy, and use the AccessKey pair as the username and password. To generate the Base64-encoded credential string, run: ReplaceAKwith your AccessKey ID andSKwith your AccessKey Secret.echo -n 'AK:SK' | base64
Collector ConfigMap
apiVersion: v1
kind: ConfigMap
metadata:
  name: otel-config
  namespace: <app-namespace>
data:
  otel-config.yaml: |
    extensions:
      zpages:
        endpoint: localhost:55679

    receivers:
      otlp:
        protocols:
          grpc:
            endpoint: 0.0.0.0:4317
          http:
            endpoint: 0.0.0.0:4318

    processors:
      batch:
      memory_limiter:
        # 75% of maximum memory up to 2G
        limit_mib: 1536
        # 25% of limit up to 2G
        spike_limit_mib: 512
        check_interval: 5s
      resource:
        attributes:
          - key: process.runtime.description
            action: delete
          - key: process.command_args
            action: delete
          - key: telemetry.distro.version
            action: delete
          - key: telemetry.sdk.name
            action: delete
          - key: telemetry.sdk.version
            action: delete
          - key: service.instance.id
            action: delete
          - key: process.runtime.name
            action: delete
          - key: process.runtime.description
            action: delete
          - key: process.pid
            action: delete
          - key: process.executable.path
            action: delete
          - key: process.command.args
            action: delete
          - key: os.description
            action: delete
          - key: instance
            action: delete
          - key: container.id
            action: delete

    connectors:
      spanmetrics:
        histogram:
          explicit:
            buckets: [0.001, 0.005, 0.01, 0.05, 0.1, 0.5, 1, 5, 10]
        dimensions:
          - name: http.method
            default: "GET"
          - name: http.response.status_code
          - name: http.route
            # Custom attribute
          - name: user.id
        metrics_flush_interval: 15s
        exclude_dimensions:
        metrics_expiration: 3m
        events:
          enabled: true
          dimensions:
          - name: default
            default: "GET"


    exporters:
      debug:
        verbosity: detailed
      prometheusremotewrite:
        # Replace with the Prometheus remote write internal network address
        endpoint: http://<Endpoint>/api/v1/write
        namespace: "acs"
        resource_to_telemetry_conversion:
          enabled: true
        timeout: 10s
        headers:
          Prometheus-Remote-Write-Version: "0.1.0"
          # Required if password-free mode is not enabled
          Authorization: Basic <base64-encoded-username-password>
        external_labels:
          data-mode: metrics


    service:
      pipelines:
        logs:
          receivers: [otlp]
          exporters: [debug]
        traces:
          receivers: [otlp]
          processors: [resource]
          exporters: [spanmetrics]
        metrics:
          receivers: [otlp]
          processors: [memory_limiter, batch]
          exporters: [prometheusremotewrite]
        metrics/2:
          receivers: [spanmetrics]
          exporters: [prometheusremotewrite]

      extensions: [zpages]
After creating the ConfigMap:
Replace
<Endpoint>with the Remote Write URL obtained earlier.Replace
<base64-encoded-username-password>with the Base64-encoded credential string. If you use the password-free policy, remove theAuthorizationheader.
Step 4: Verify your setup
After deploying the Collector and applying the configuration, verify that metrics are flowing to Managed Service for Prometheus:
Log on to the CloudMonitor console.
In the left-side navigation pane, choose Managed Service for Prometheus > Instances.
Click the name of your Prometheus instance.
In the left sidebar of the instance details page, select Metric Management, then click the Metrics Explorer tab. Enter the following PromQL query and click Run Query: If the query returns results with your target labels, metrics are being collected successfully.
upTo verify that application-specific metrics are flowing, query a metric from your application. For example: This query returns all metrics with the
acsnamespace prefix.{__name__=~"acs_.*"}
Metrics may take a few minutes to appear after deployment. If no metrics appear, check the Collector logs for errors related to OTLP connection, authentication, or endpoint configuration.