This topic describes how to view the Object Storage Service (OSS) bill analysis report, customize query and analysis statements, and configure alerts for OSS costs.
OSS instance
In OSS billing, an instance is the smallest billing unit combining region ID and storage class. The format of an instance ID is region ID;storage class, such as cn-hangzhou;Standard.
View your OSS bill analysis report
Cost Manager provides two statistical reports: Bill Self-service Analysis and Cost Trends and Structure.
Click OSS Bill Self-service Analysis to view OSS costs, storage, and traffic usage.
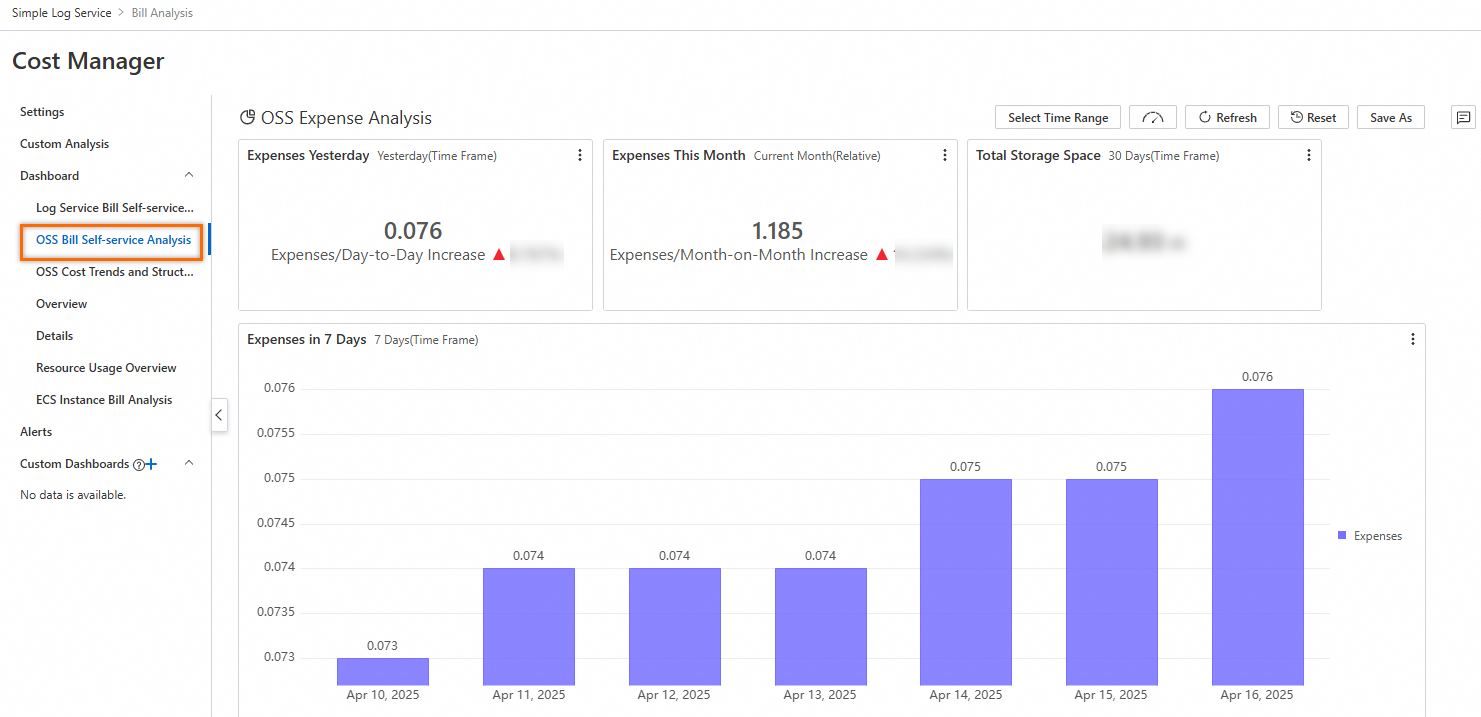
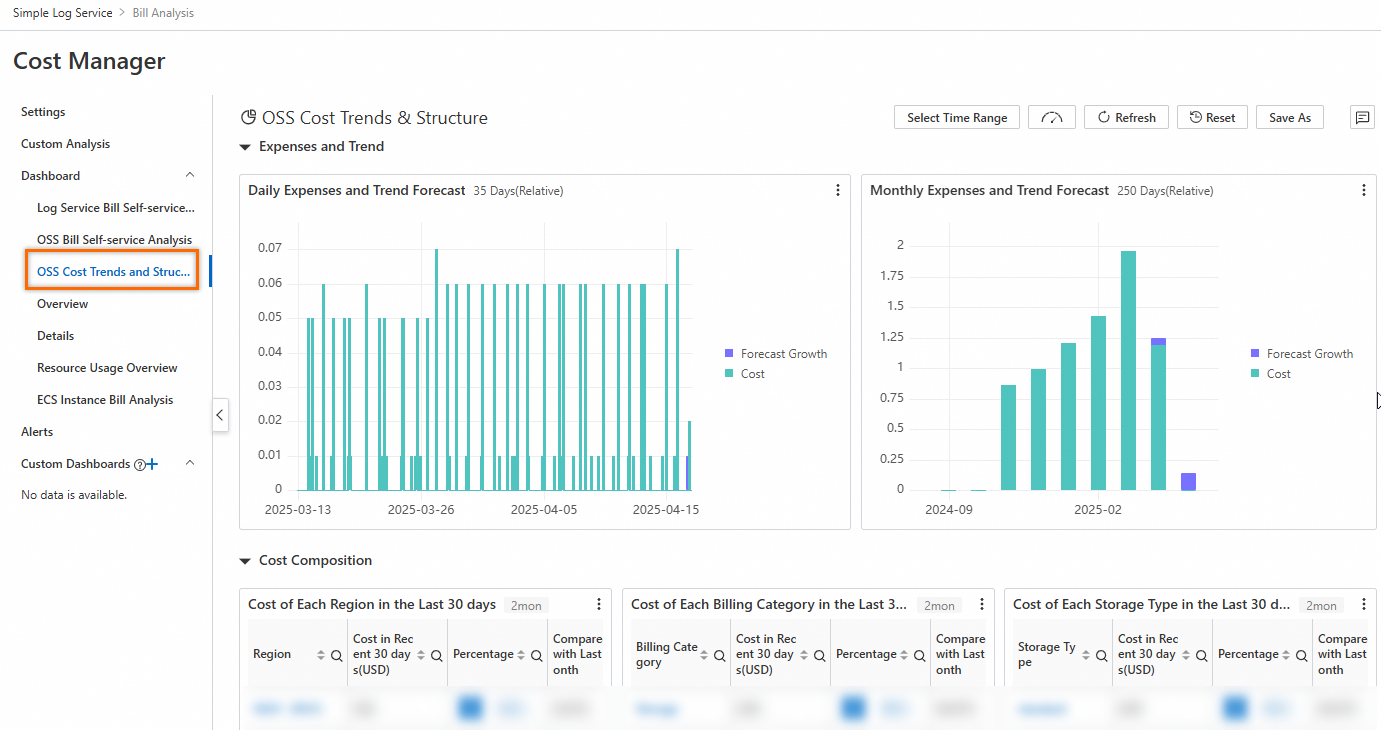
Click OSS Cost Trends and Structure to view cost details and predictions for the past month, along with consumption data and cost forecasts for the past six months. The Cost Composition section provides statistics by region, billing category, and storage class for cost distribution analysis.
Custom analysis of OSS costs
Customize query and analysis statements in Custom Analysis of Cost Manager.
Example 1: Calculate instance-level costs
Use the following query and analysis statement to calculate the costs of each OSS instance.
* | select
  instanceId,
  split_part(InstanceID, ';', 1) as region,
  split_part(InstanceID, ';', 2) as type,
  sum(PretaxAmount) as cost
FROM  instance_bill
where
  productcode = 'oss'
group by
  split_part(InstanceID, ';', 1),
  split_part(InstanceID, ';', 2),
  instanceId
Example 2: Query daily costs for an instance
Use the following query and analysis statement to calculate the daily costs of each billing item for an OSS instance. Replace ${instanceId} with the actual value.
* | select
  date_trunc('day', __time__) as t,
  billingItem,
  sum(PretaxAmount) as cost
FROM  instance_bill
where
  productcode = 'oss'
  and instanceId = '${instanceId}'
group by
  t,
  billingItem
order by
  t
Configure alerts for instance costs
The following example shows how to configure an alert when an instance's total costs exceed the threshold.
In the left-side navigation pane, click Alerts. On the Alert Center page, click Create Alert.

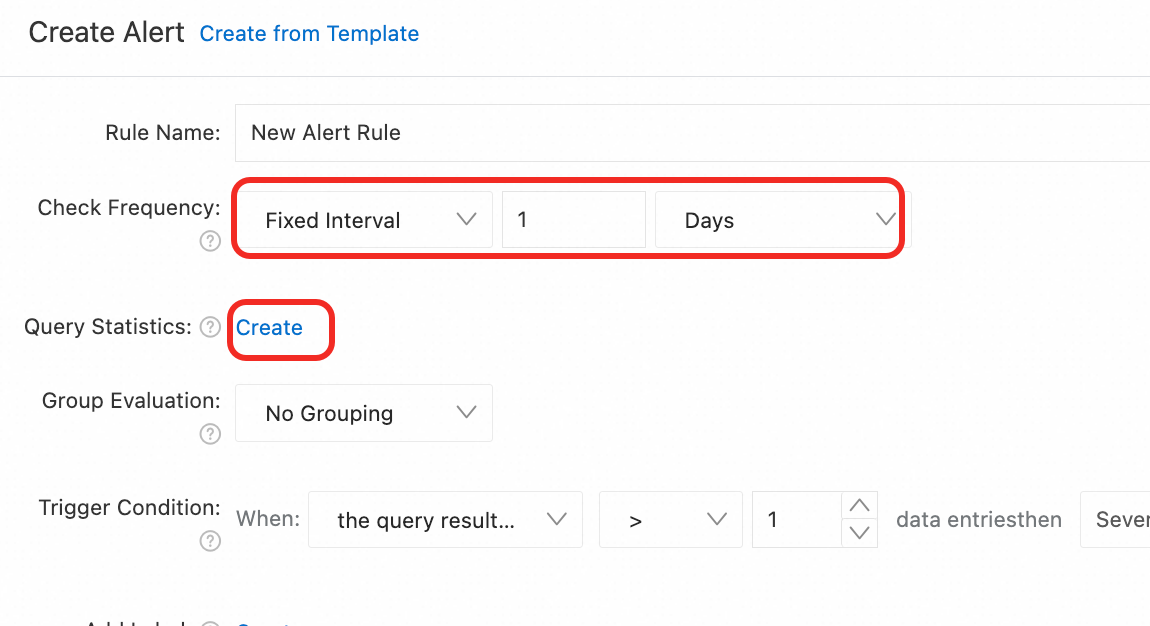
On the Create Alert page, configure the related parameters.
Set Check Frequency to Fixed Interval and 1 day. Then, click Create in the Query Statistics field.
On the Query Statistics page, select a logstore, and set Time Range to Yesterday. Configure the following query analysis statement to query the total costs of the instance yesterday. Then, click Confirm.
* | select
  instanceId,
  sum(PretaxAmount) as cost
FROM  instance_bill
where
  productcode = 'oss'
group by
  instanceId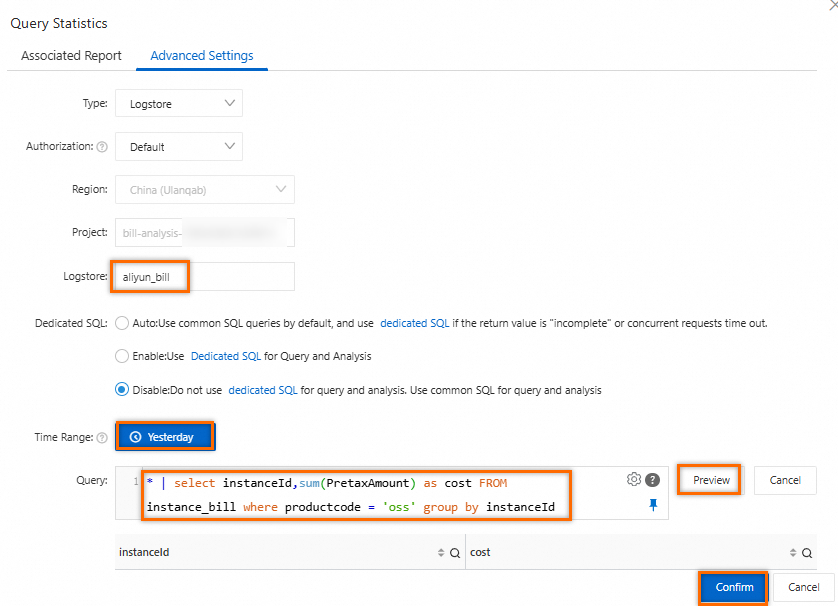
On the Create Alert page, set Trigger Condition to data matches the expression. Then, set the matching condition to
costgreater than your alert threshold. The example uses an alert threshold of 10. For other parameters, refer to Configuration description.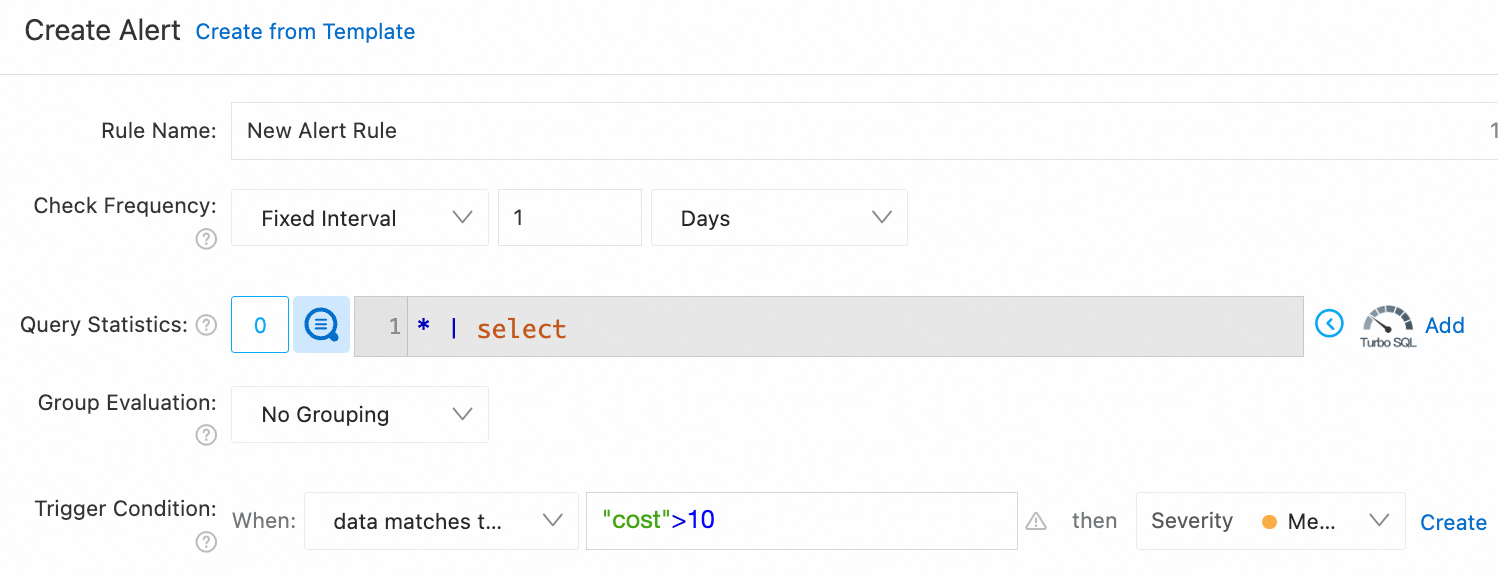
After configuring the alert, view alert records on the alert dashboard.