This topic describes how to view the Simple Log Service (SLS) bill analysis report, customize query and analysis statements, and configure alerts when SLS storage usage reaches a specified threshold.
SLS billing data
Billing data reflects Alibaba Cloud service usage. Use the following query and analysis statement to check your SLS billing details:
* |
select
  BillingDate,
  BillingItem,
  BillingType,
  CostUnit,
  Currency,
  DeductedByCashCoupons,
  DeductedByCoupons,
  DeductedByPrepaidCard,
  DeductedByResourcePackage,
  InstanceConfig,
  InstanceID,
  InstanceSpec,
  InvoiceDiscount,
  Item,
  ListPrice,
  ListPriceUnit,
  NickName,
  OutstandingAmount,
  OwnerID,
  PaymentAmount,
  PretaxAmount,
  PretaxGrossAmount,
  ProductCode,
  ProductDetail,
  ProductName,
  ProductType,
  Region,
  ResourceGroup,
  ServicePeriod,
  SubscriptionType,
  Tag,
  Usage,
  UsageUnit,
  Zone
from
  instance_bill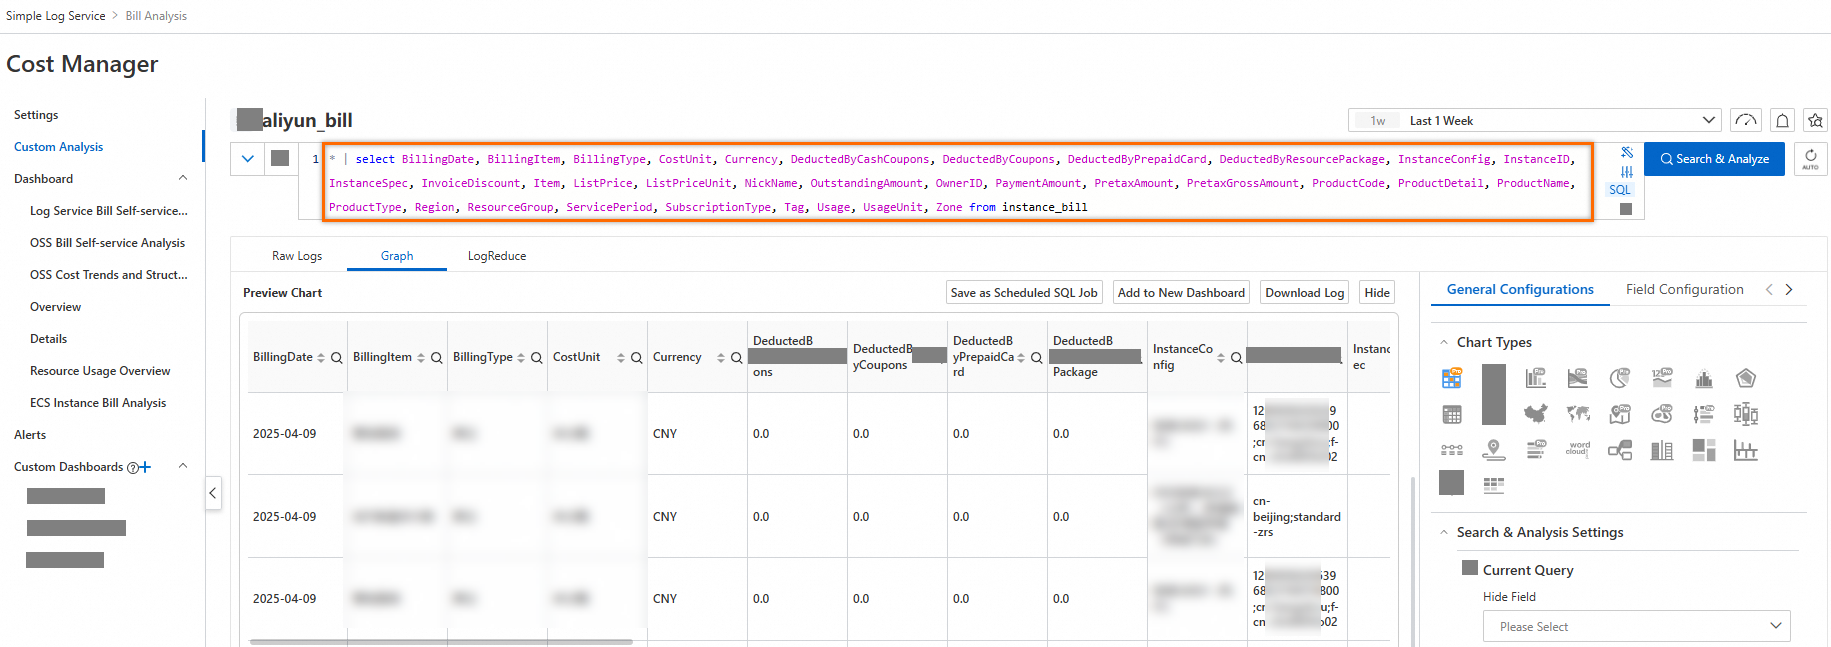
The descriptions of instances and billing items are as follows:
Name | Field | Description | Example |
Instance | InstanceID | The smallest granularity resource of a cloud service. For SLS, it is a logstore. The InstanceID format is | 12345;test-project;test-logstore;cn-guangzhou |
Billing item | BillingItem | The SLS billing items, such as storage space and index traffic. | Index traffic |
View the SLS bill analysis report
On the Cost Manager page, click Log Service Bill Self-service Analysis to view the detailed bill information, including the costs and usage trends.
The top of the page provides global filtering options. Select the corresponding Project, Logstore, Region, and OwnerId to analyze an instance's usage.
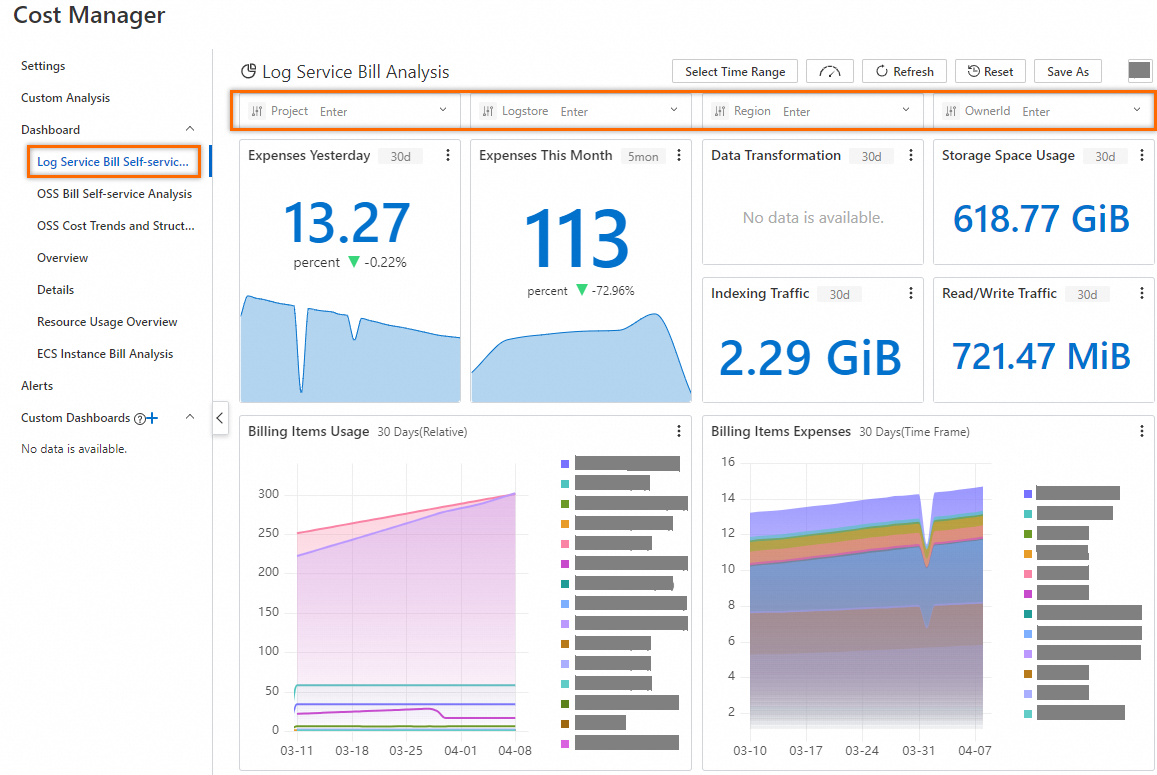
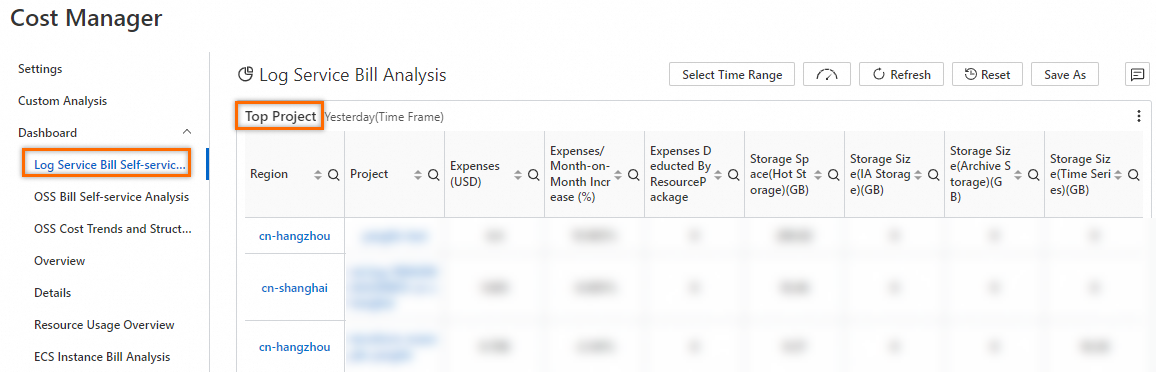
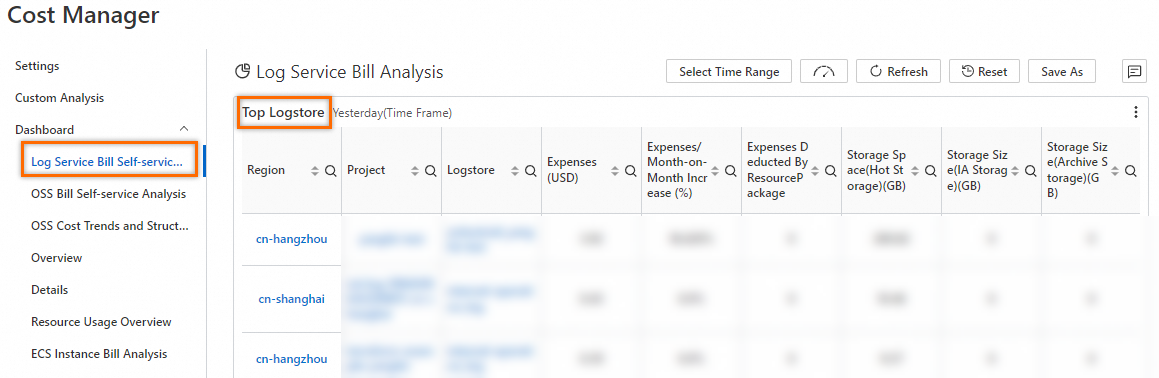
The bill analysis offers detailed usage insights for your most used projects and logstores, so you can track their resources.
SLS billing usage analysis
Example 1: View yesterday's amount
Click Log Service Bill Self-service Analysis and find the Expenses Yesterday chart.
Hover your cursor over
 at the top-right corner of the chart, and click Preview Query Statement.
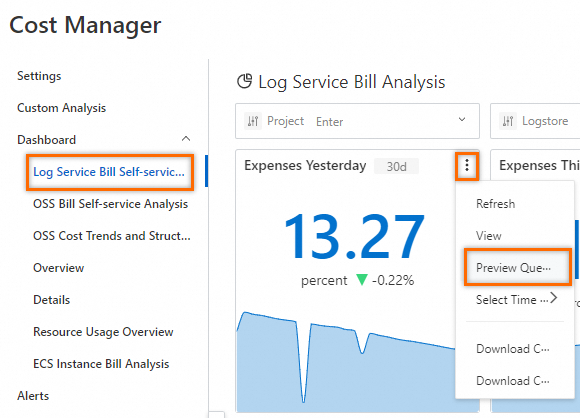
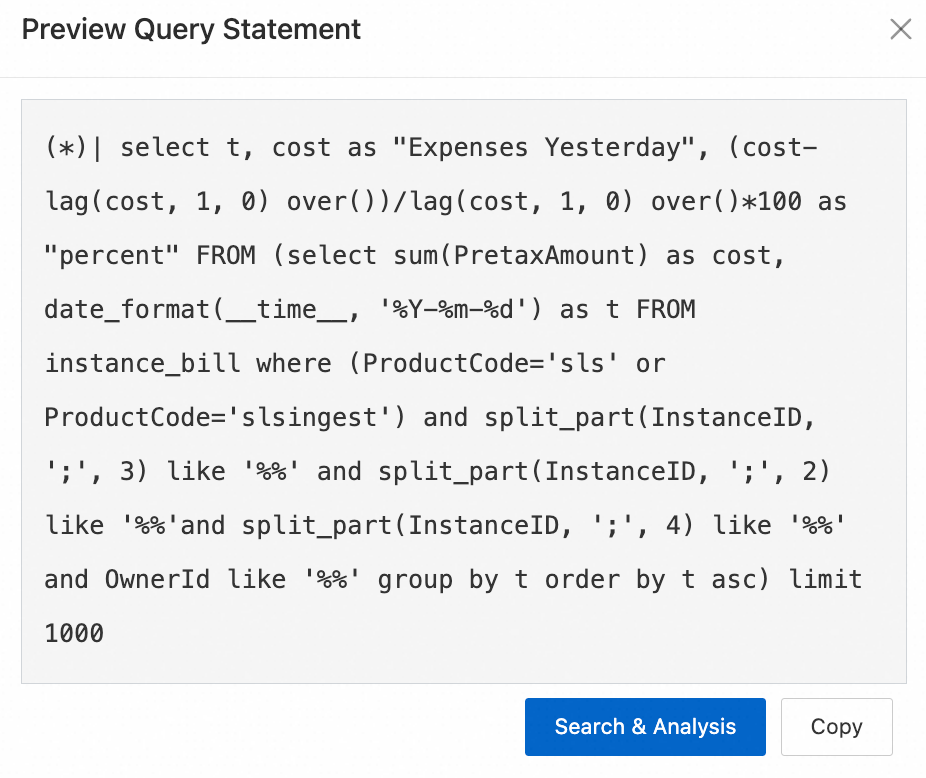
Query and analysis statement:
(*) |
select
  t,
  cost as "Expenses Yesterday",
  (cost - lag(cost, 1, 0) over()) / lag(cost, 1, 0) over() * 100 as "percent"
FROM
  (
    select
      sum(PretaxAmount) as cost,
      date_format(__time__, '%Y-%m-%d') as t
    FROM
      instance_bill
    where
      (
        productcode = 'sls'
        or productcode = 'slsingest'
      )
      and split_part(InstanceID, ';', 3) like '%%'
      and split_part(InstanceID, ';', 2) like '%%'
      and split_part(InstanceID, ';', 4) like '%%'
      and OwnerId like '%%'
    group by
      t
    order by
      t asc
  )
limit
  1000
To modify the statement, click Search & Analysis.
Example 2: Query usage trends of billing items
Use the following query and analysis statement to view the usage trend of each billing item.
 * |
select
  date_trunc('day', __time__) as t,
  BillingItem,
  round(sum(Usage), 2) as "Usage"
from instance_bill
where ProductCode='sls'
group by BillingItem, t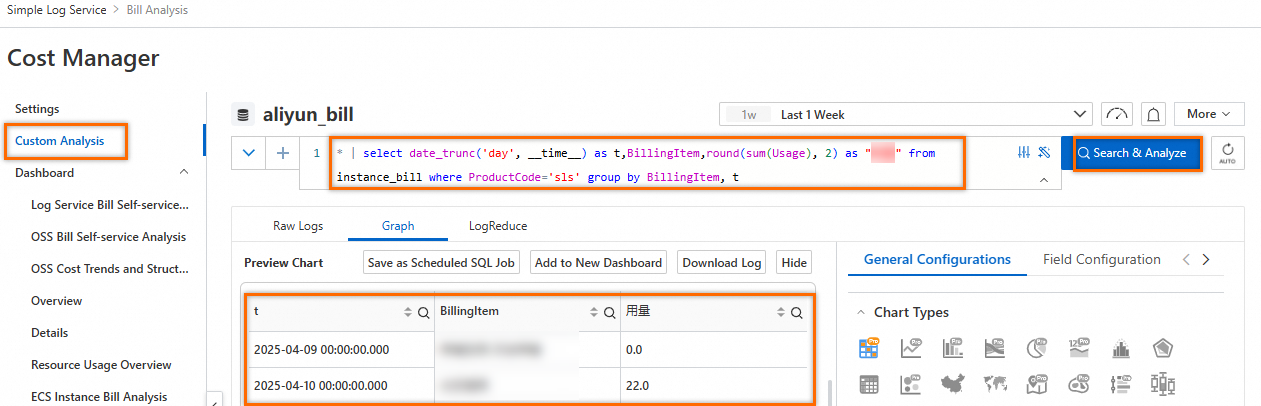
Example 3: Query usage details of each project and logstore
Use the following query and analysis statement to query usage details of each project and logstore. Replace ${project_name} with the actual project name.
 * | select
  split_part(instanceId, ';', 2) as project,
  split_part(instanceId, ';', 3) as logstore,
  split_part(instanceId, ';', 4) as region,
  BillingItem as "Billing Item",
  round(sum(Usage), 2) as "Usage"
FROM  instance_bill
where
  ProductCode = 'sls'
  and split_part(instanceId, ';', 2) like '${project_name}'
group by
  BillingItem,
  project,
  logstore,
  region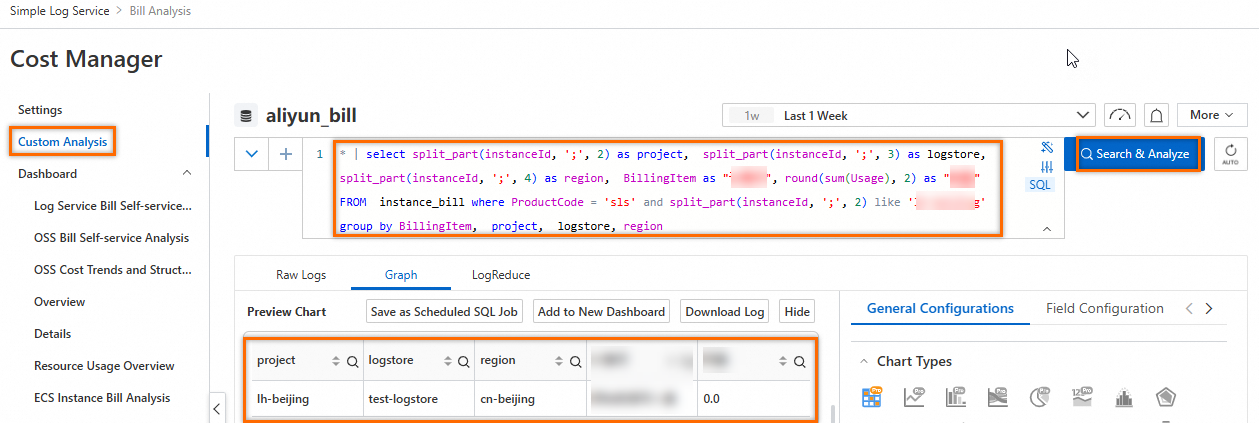
Configure alerts for SLS storage usage
The following example shows how to configure an alert when the SLS storage usage exceeds the threshold.
In the left-side navigation pane, click Alerts. On the Alert Center page, click Create Alert.

On the Create Alert page, configure the related parameters.
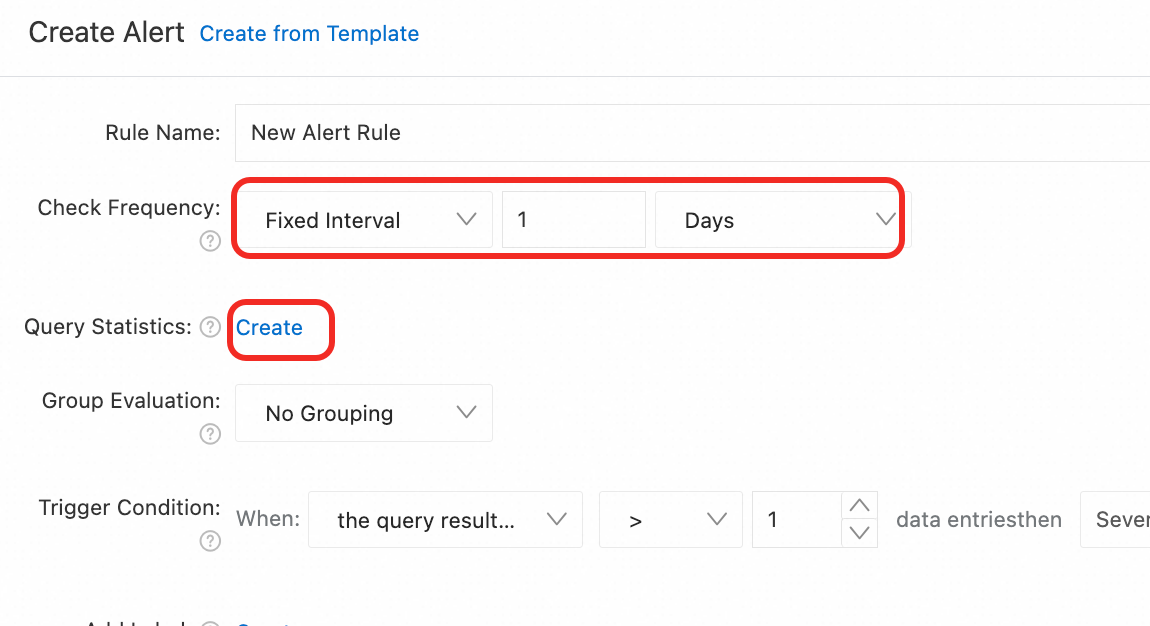
Set Check Frequency to Fixed Interval and 1 day. Then, click Create in the Query Statistics field.
On the Query Statistics page, select a logstore, and set Time Range to Yesterday. Configure the following query and analysis statement to query the storage usage. Then, click Confirm.
* |
select
   round(sum(Usage), 2) as "Storage usage"
from instance_bill
where ProductCode='sls'
and BillingItem like '%bucket%'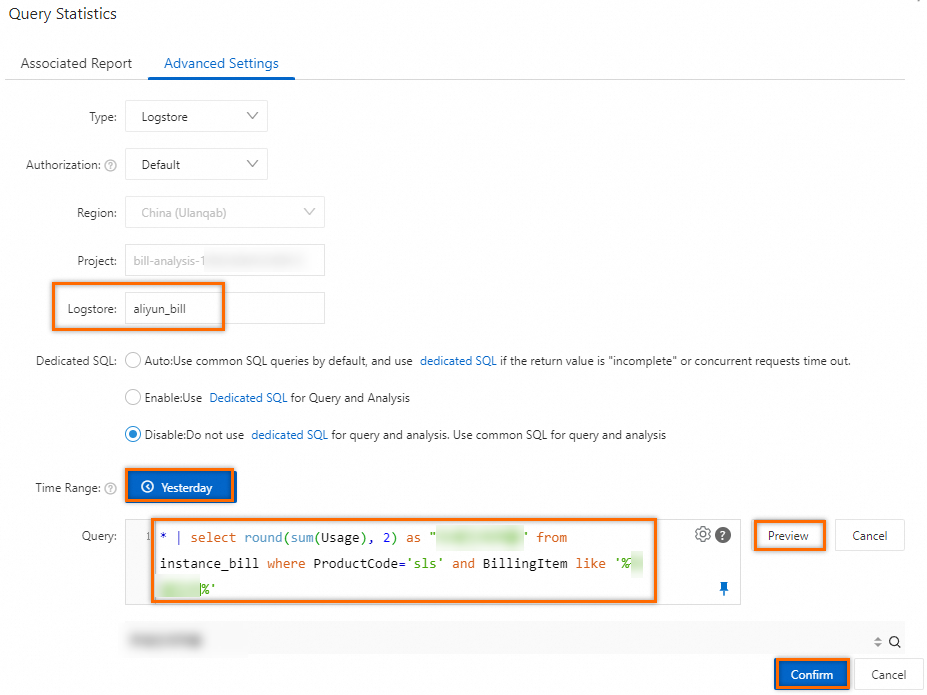
On the Create Alert page, set Trigger Condition to data matches the expression. Then, set the matching condition to
Storage usagegreater than your alert threshold. The example uses an alert threshold of 400. For other parameters, refer to Configuration description.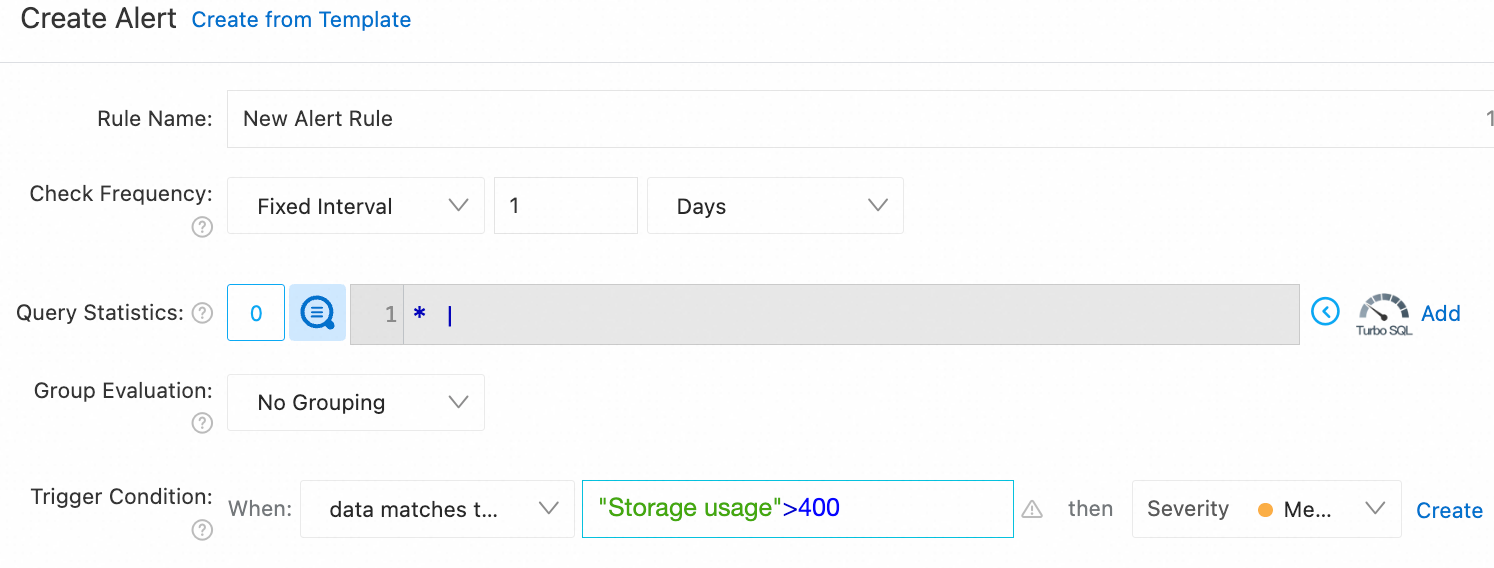
After configuring the alert, view alert records on the alert dashboard.