Simple Log Service provides the following syntax that you can use to query and analyze metrics: PromQL, SQL, and the combination of PromQL and SQL. You can specify alert rules based on specific query requirements to accurately monitor key metrics and send alert notifications at the earliest opportunity. This topic provides common examples of creating an alert rule for a Metricstore.
Use a PromQL statement to query and analyze data and create an alert rule
On the query and analysis page of a Metricstore, use a PromQL statement to query the growth rate for the number of requests. For more information, see PromQL. In the upper-right corner of the page, click Save as Alert to save the PromQL statement as an alert rule.
rate(apiserver_request_total[1m])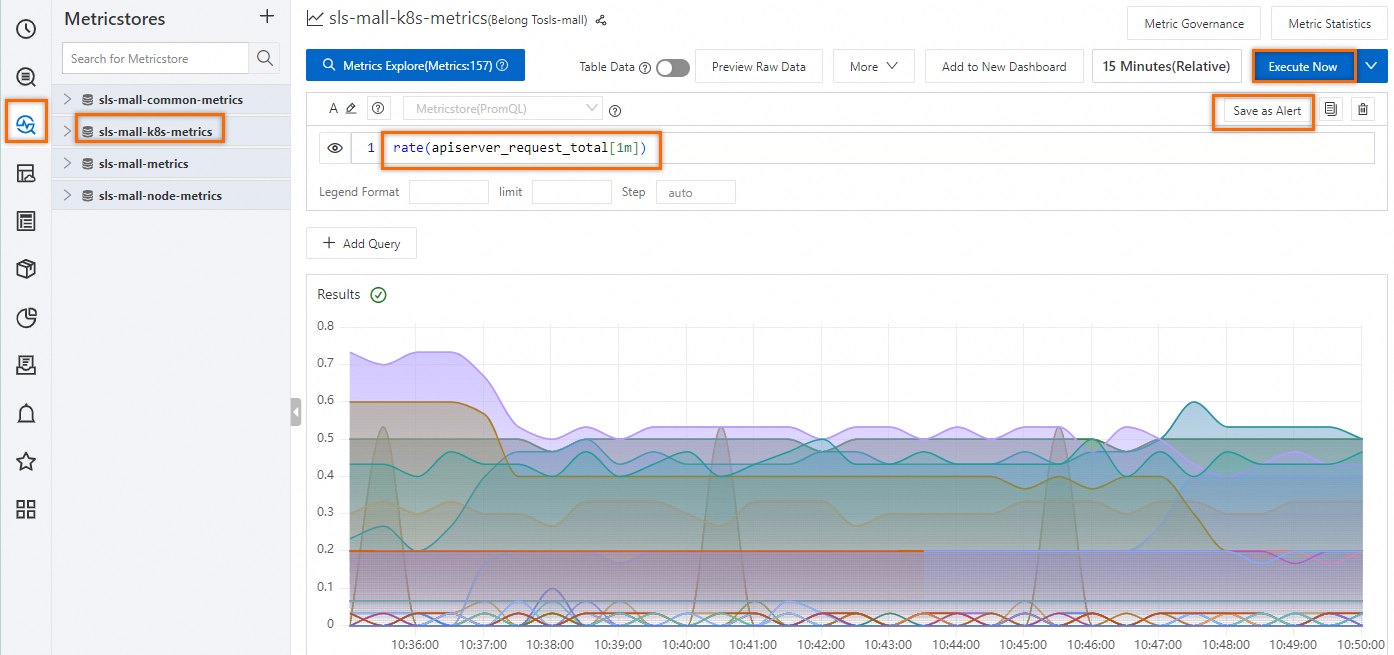
In the Alert Monitoring Rule page, configure the parameters, such as Rule Name, Check Frequency, Trigger Condition, and Destination, and click OK. For more information, see Configure an alert rule in Simple Log Service.
Use the combination of SQL and PromQL syntax to query and analyze data and create an alert rule
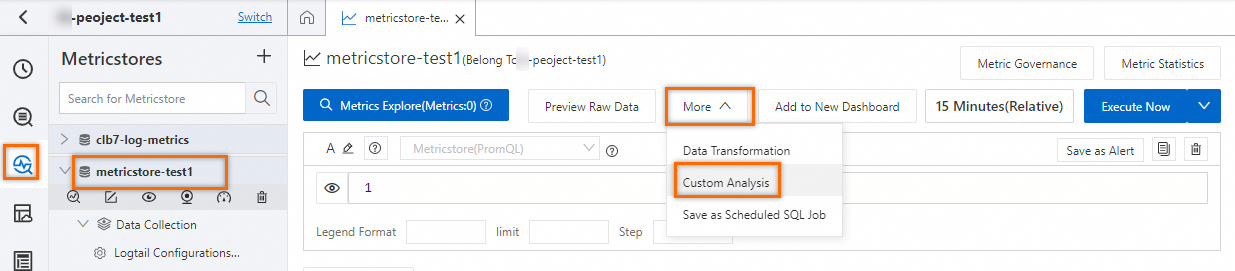
On the query and analysis page of a Metricstore, choose . You are then navigated to the query and analysis page of the Logstore with the same name as the Metricstore.
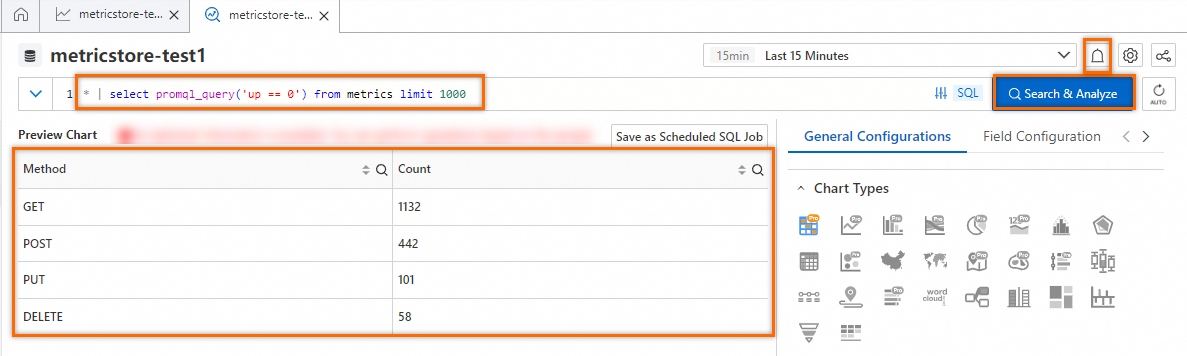
On the query and analysis page of the Logstore, use the SQL syntax and the PromQL functions provided by Simple Log Service to perform a nested query and preview the query results. In the upper-right corner of the page, click the Save as Alert icon to configure an alert rule. For more information, see Configure an alert rule in Simple Log Service. The following section provides common examples for creating an alert rule:
The up metric indicates the active status of a process. Check whether a process is active based on the specified alert rule. SQL statement:
* | select promql_query('up == 0') from metrics limit 1000The
process_resident_memory_bytesmetric indicates resident memory. If the resident memory of an instance exceeds 8 GB, an alert is triggered based on the specified alert rule. SQL statement:* | select promql_query('process_resident_memory_bytes/1024/1024/1024 > 8') from metrics limit 1000If the CPU utilization exceeds 500%, an alert is triggered based on the specified alert rule. SQL statement:
* | select promql_query('rate(process_cpu_seconds_total[1m]) > 5') from metrics limit 1000If the number of goroutines in a Go process exceeds 500, an alert is triggered based on the specified alert rule. SQL statement:
* | select promql_query('sum by(instance) (go_goroutines) > 500') from metrics limit 1000If the garbage collection (GC) duration is excessively long, an alert is triggered based on the specified alert rule. SQL statement:
* | select promql_query('sum(rate(go_gc_duration_seconds_sum[1m])) by (instance) /sum(rate(go_gc_duration_seconds_count[1m])) by (instance) > 0.1') from metrics limit 1000