PolarDB Serverless automatically adjusts compute resources in response to load—scaling a single node up or out across multiple read-only nodes without manual intervention. This guide uses Sysbench to walk through both behaviors so you can reproduce the tests and observe the results in your own cluster.
PolarDB Serverless is built on the architecture described in the "PolarDB Serverless: A Cloud Native Database for Disaggregated Data Centers" paper.
How it works
PolarDB Serverless scales along two dimensions:
Vertical scaling (scale-up): The primary node's compute resources—measured in PCU—increase as load rises and decrease when load drops.
Horizontal scaling (scale-out): Additional read-only nodes join the cluster when read-intensive load exceeds what a single node can handle. They are released gradually after load subsides.
Both dimensions can operate together. The tests in this guide cover each independently.
Prerequisites
Before you begin, ensure that you have:
An Elastic Compute Service (ECS) instance (ecs.g7.4xlarge, 16 vCPU / 64 GiB) running Alibaba Cloud Linux 3.2104 LTS 64-bit with a standard SSD system disk (PL0, 100 GB)
A PolarDB for PostgreSQL Serverless cluster (Standard Edition, ESSD AutoPL storage with Provisioned IOPS set to 0, 100 GB) in the same region and virtual private cloud (VPC) as the ECS instance
Sysbench installed on the ECS instance (see Install Sysbench)
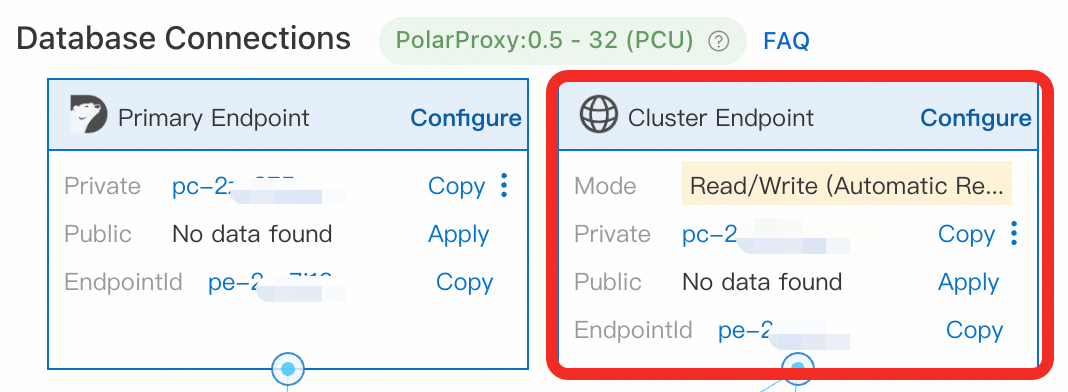
A database account, a database, and the cluster's Cluster Endpoint — use the Cluster Endpoint, not the Primary Endpoint
The ECS instance and the PolarDB cluster must be in the same VPC. Add the ECS instance's private IP address to the cluster's IP whitelist, or add the security group the ECS instance belongs to.
Install Sysbench
Log in to the ECS instance as root and run:
sudo yum -y install sysbenchThis command applies to Alibaba Cloud Linux. For other operating systems, follow the Sysbench documentation.
Prepare test data
Run the following command to create 32 tables with 100,000 rows each. Replace the placeholders with your cluster's connection details.
sysbench /usr/share/sysbench/oltp_read_write.lua \
  --pgsql-host=<host> \
  --pgsql-port=<port> \
  --pgsql-user=<user> \
  --pgsql-password=<password> \
  --pgsql-db=<database> \
  --tables=32 \
  --table-size=100000 \
  --report-interval=1 \
  --range_selects=1 \
  --db-ps-mode=disable \
  --rand-type=uniform \
  --threads=32 \
  --db-driver=pgsql \
  --time=12000 \
  prepare
Replace the following placeholders with your actual values:
| Placeholder | Description | Example |
|---|---|---|
<host> | Cluster Endpoint | pc-xxxx.pg.polardb.rds.aliyuncs.com |
<port> | Port for the Cluster Endpoint | 5432 |
<user> | Database account name | test_user |
<password> | Password for the database account | — |
<database> | Database name | testdb |
Data preparation takes approximately 5 minutes. The cluster may scale up during this process. After preparation completes, wait 3–5 minutes for the primary node to scale back down to 1 PCU before running any tests.
Key parameters:
--db-ps-mode=disable: Disables prepared statements so all SQL runs as raw queries.--threads=32: Sets concurrency for the preparation phase.
Test 1: Single-node scale-up
This test verifies that the primary node scales up and down automatically in response to load. Read-only nodes are disabled so vertical scaling is isolated.
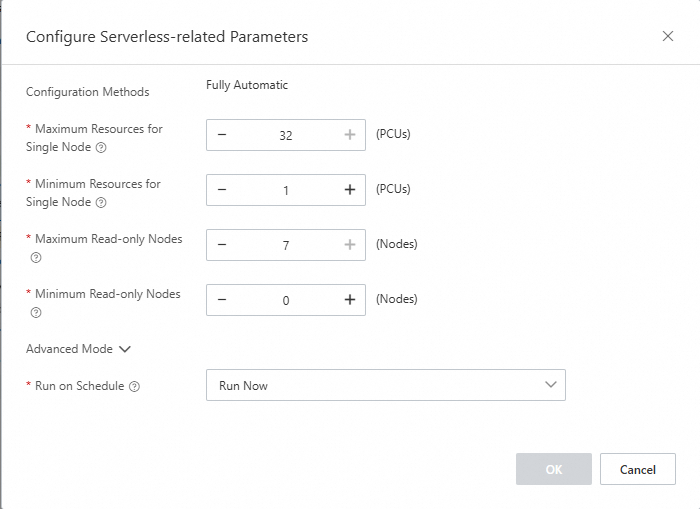
Configure Serverless settings
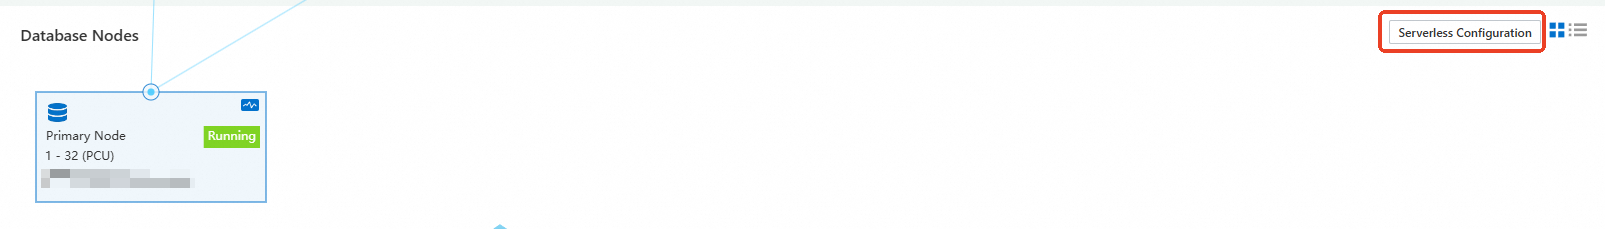
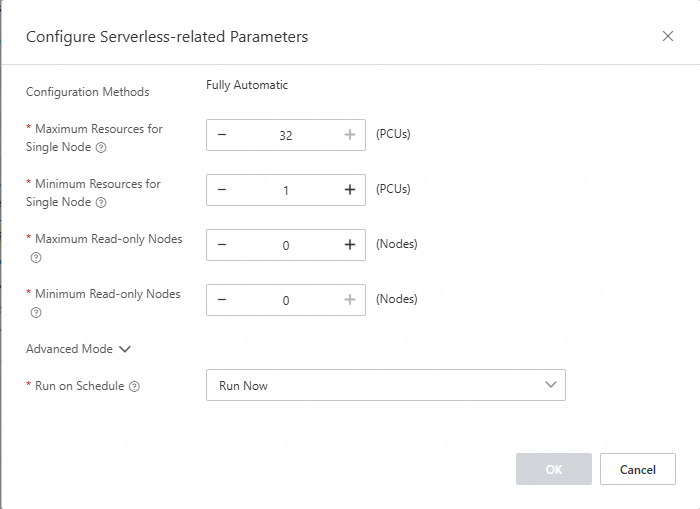
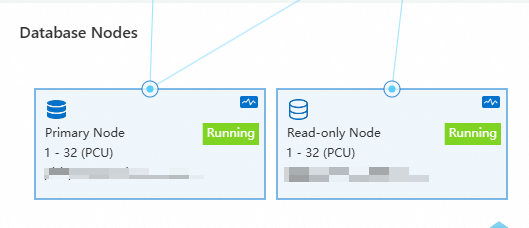
In the PolarDB console, open the cluster details page and go to the Database Nodes section. Set the following values:
Maximum Resources for Single Node: 32
Minimum Resources for Single Node: 1
Maximum Read-only Nodes: 0
Minimum Read-only Nodes: 0
Low-load test (16 threads)
Run Sysbench with 16 concurrent threads to observe how the cluster responds to moderate load:
sysbench /usr/share/sysbench/oltp_read_write.lua \
--pgsql-host=<host> \
--pgsql-port=<port> \
--pgsql-user=<user> \
--pgsql-password=<password> \
--pgsql-db=<database> \
--tables=32 \
--table-size=100000 \
--report-interval=1 \
--range_selects=1 \
--db-ps-mode=disable \
--rand-type=uniform \
--threads=16 \
--db-driver=pgsql \
--time=12000 \
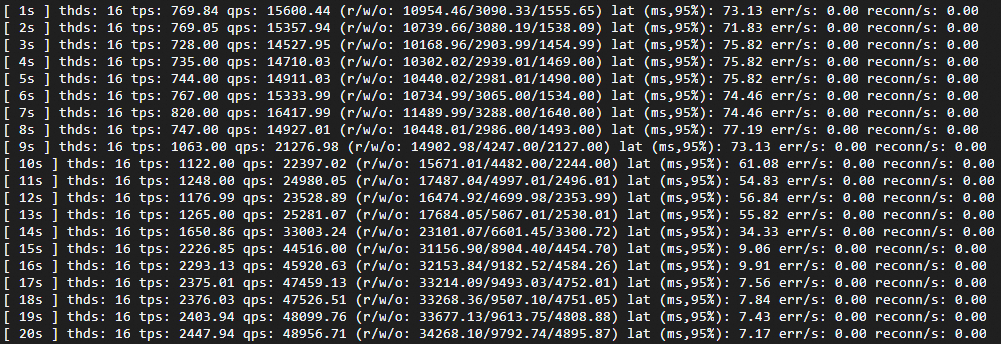
runExpected results:
Transactions per second (TPS) rises while latency falls, both stabilizing once the cluster reaches its new resource level.
Monitor the scaling behavior:
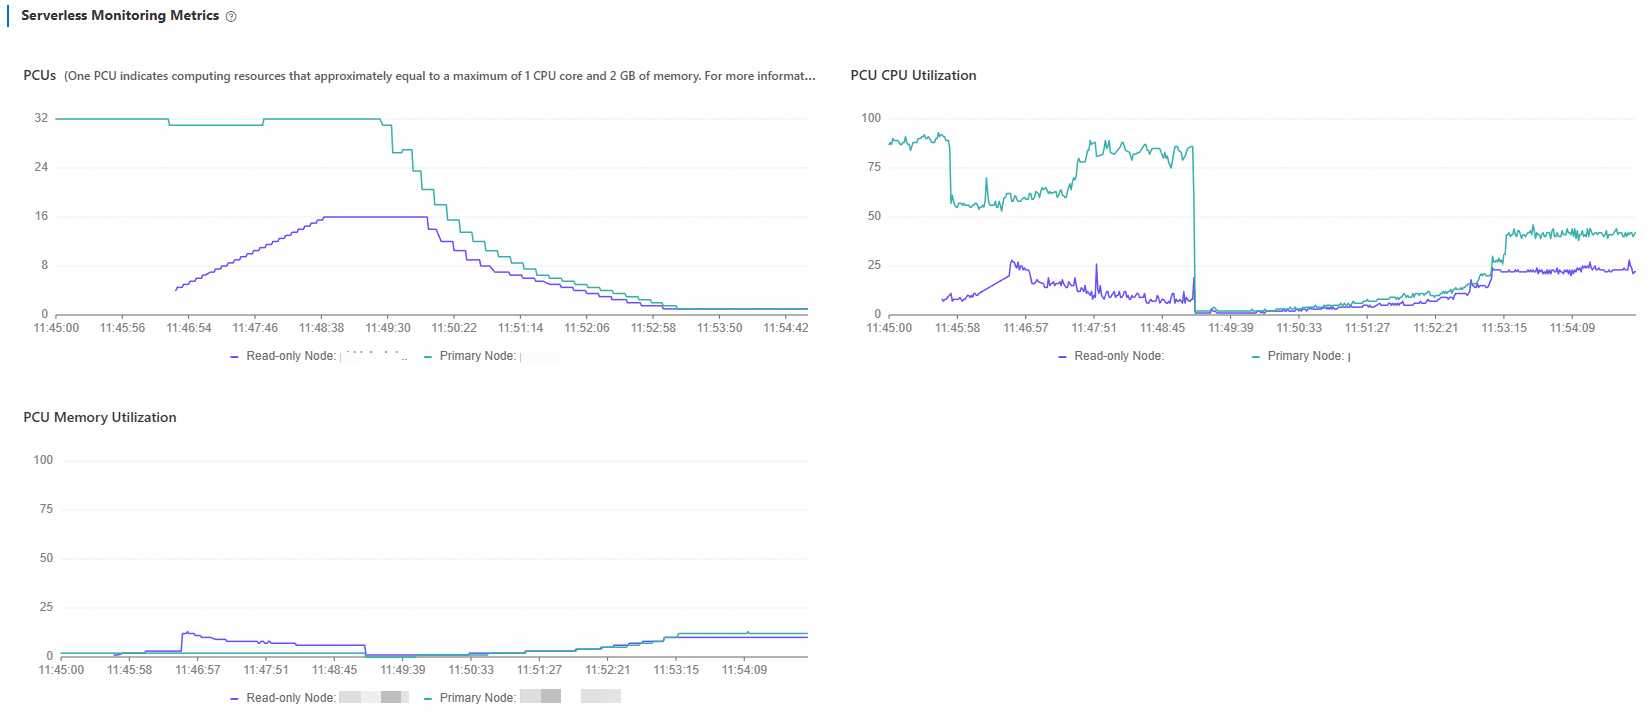
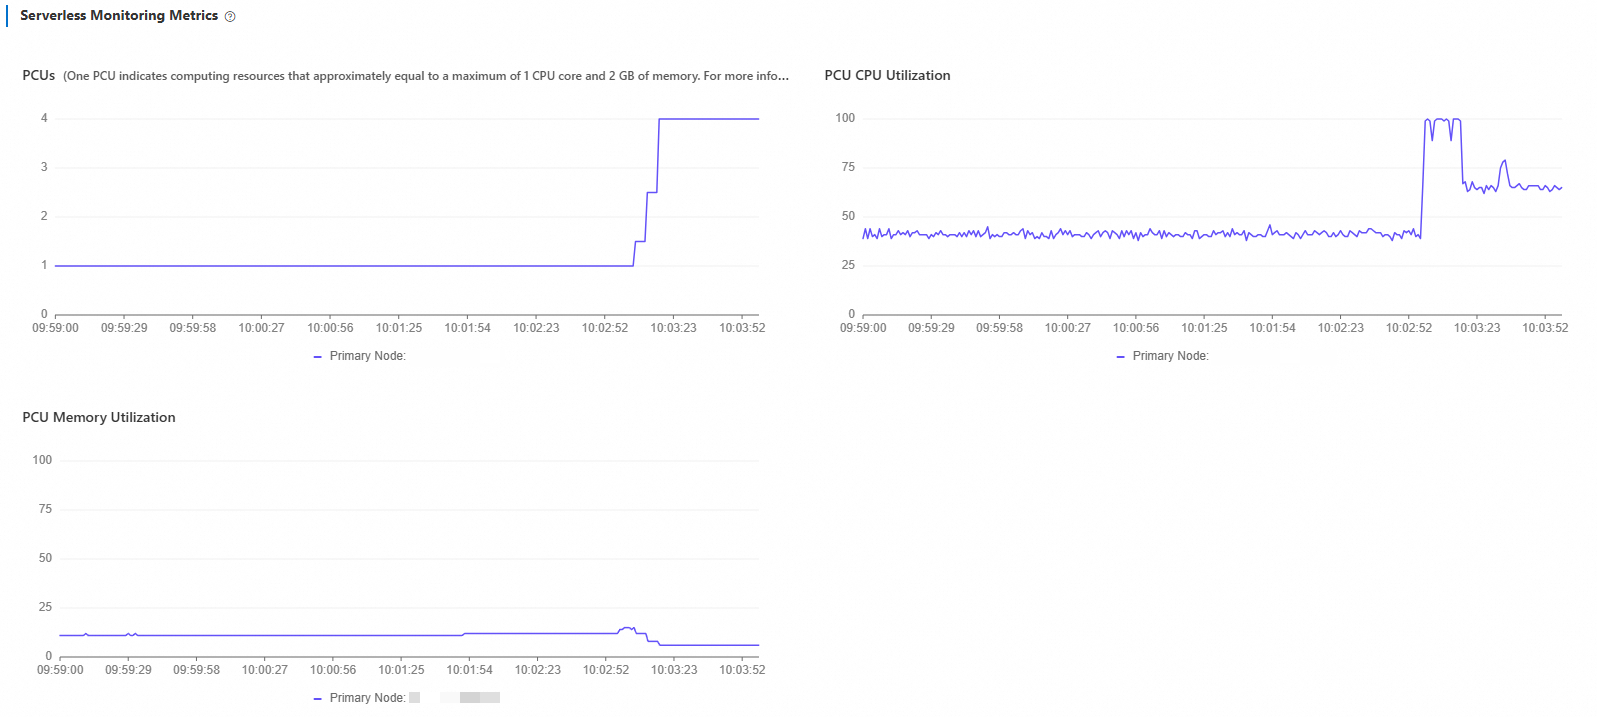
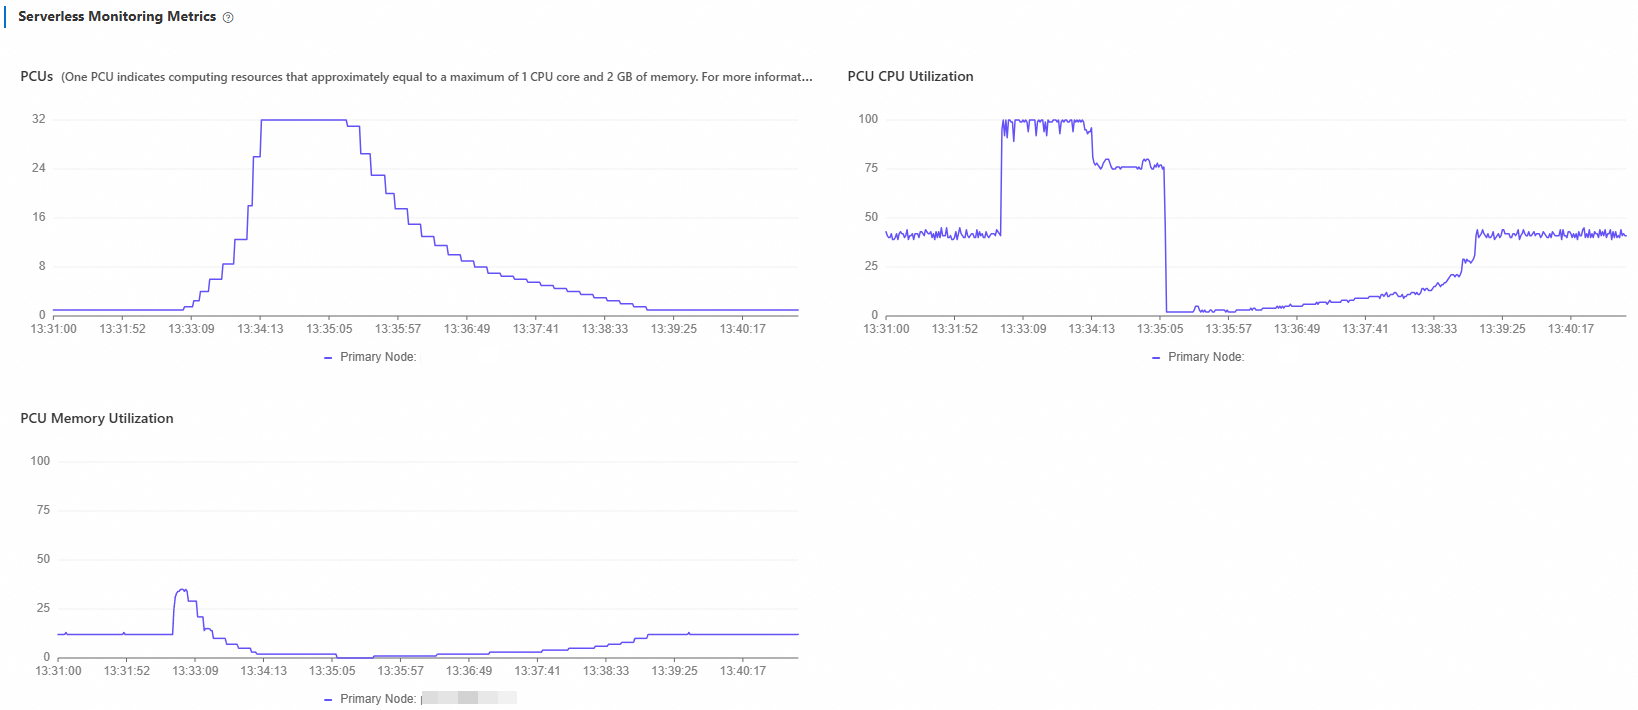
In the PolarDB console, go to Performance Monitoring and open Serverless Monitoring Metrics. Set the time range to Last 5 Minutes.
You will see PCU increase from 1 to 4 and then stabilize. CPU utilization drops gradually as resources expand. Memory utilization shows pulse-like spikes at each PCU step: when a new PCU is added, memory capacity grows and utilization dips momentarily, then climbs as the database expands its buffer pool.
What to look for when reading this chart:
If PCU stabilizes well below the maximum (32), your current peak fits within a single node.
If PCU approaches or holds at the maximum, consider increasing Maximum Resources for Single Node or enabling read-only nodes for horizontal scale-out.
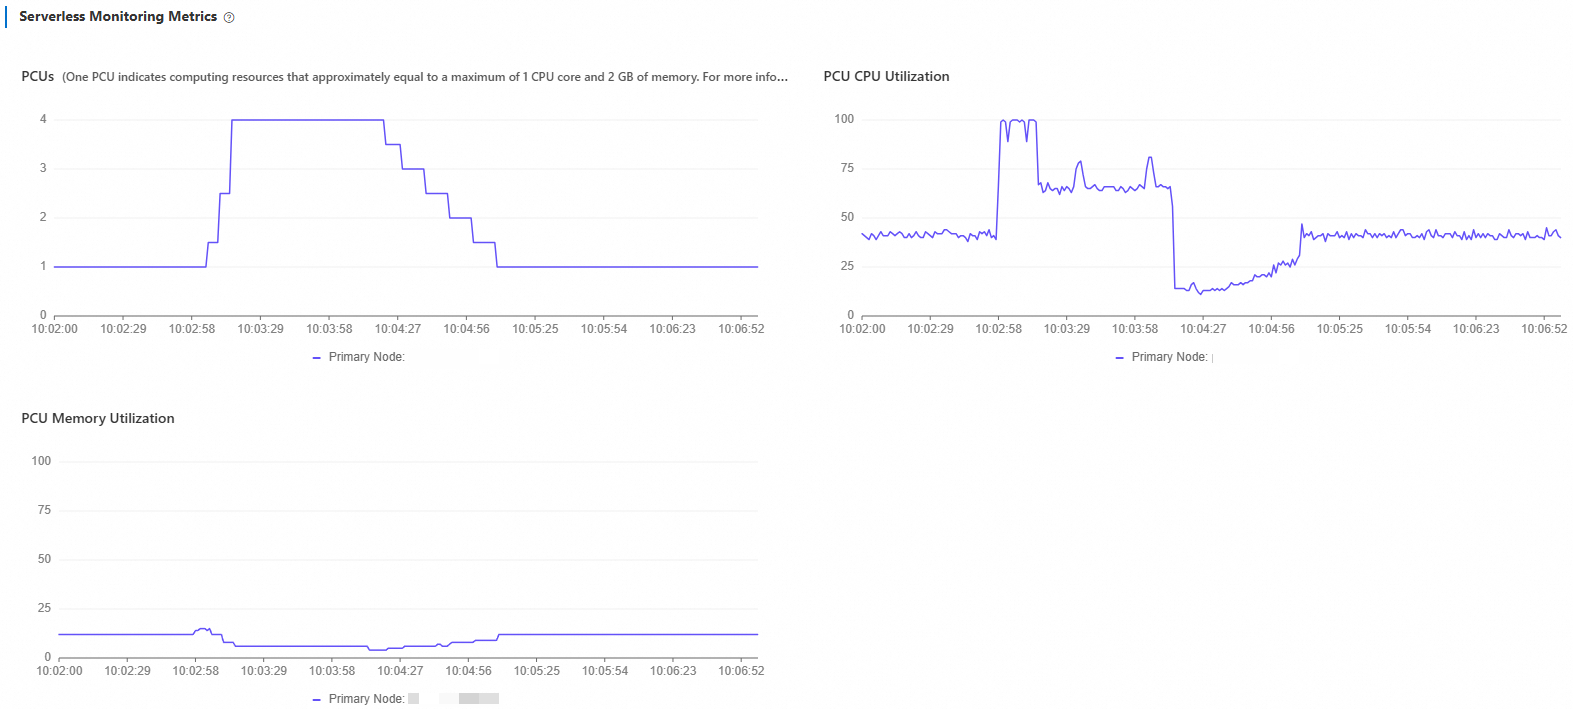
Stop the test and wait 5 minutes. Set the time range to Last 10 Minutes to confirm scale-down behavior.
PCU decreases gradually from 4 back to 1. Because the read-write mixed workload includes UPDATE operations, the primary node continues running vacuum for a short period after load stops, which keeps CPU utilization slightly elevated before it drops to baseline.
High-load test (128 threads)
Increase concurrency to 128 threads to drive the cluster to its maximum specification of 32 PCU:
sysbench /usr/share/sysbench/oltp_read_write.lua \
--pgsql-host=<host> \
--pgsql-port=<port> \
--pgsql-user=<user> \
--pgsql-password=<password> \
--pgsql-db=<database> \
--tables=32 \
--table-size=100000 \
--report-interval=1 \
--range_selects=1 \
--db-ps-mode=disable \
--rand-type=uniform \
--threads=128 \
--db-driver=pgsql \
--time=12000 \
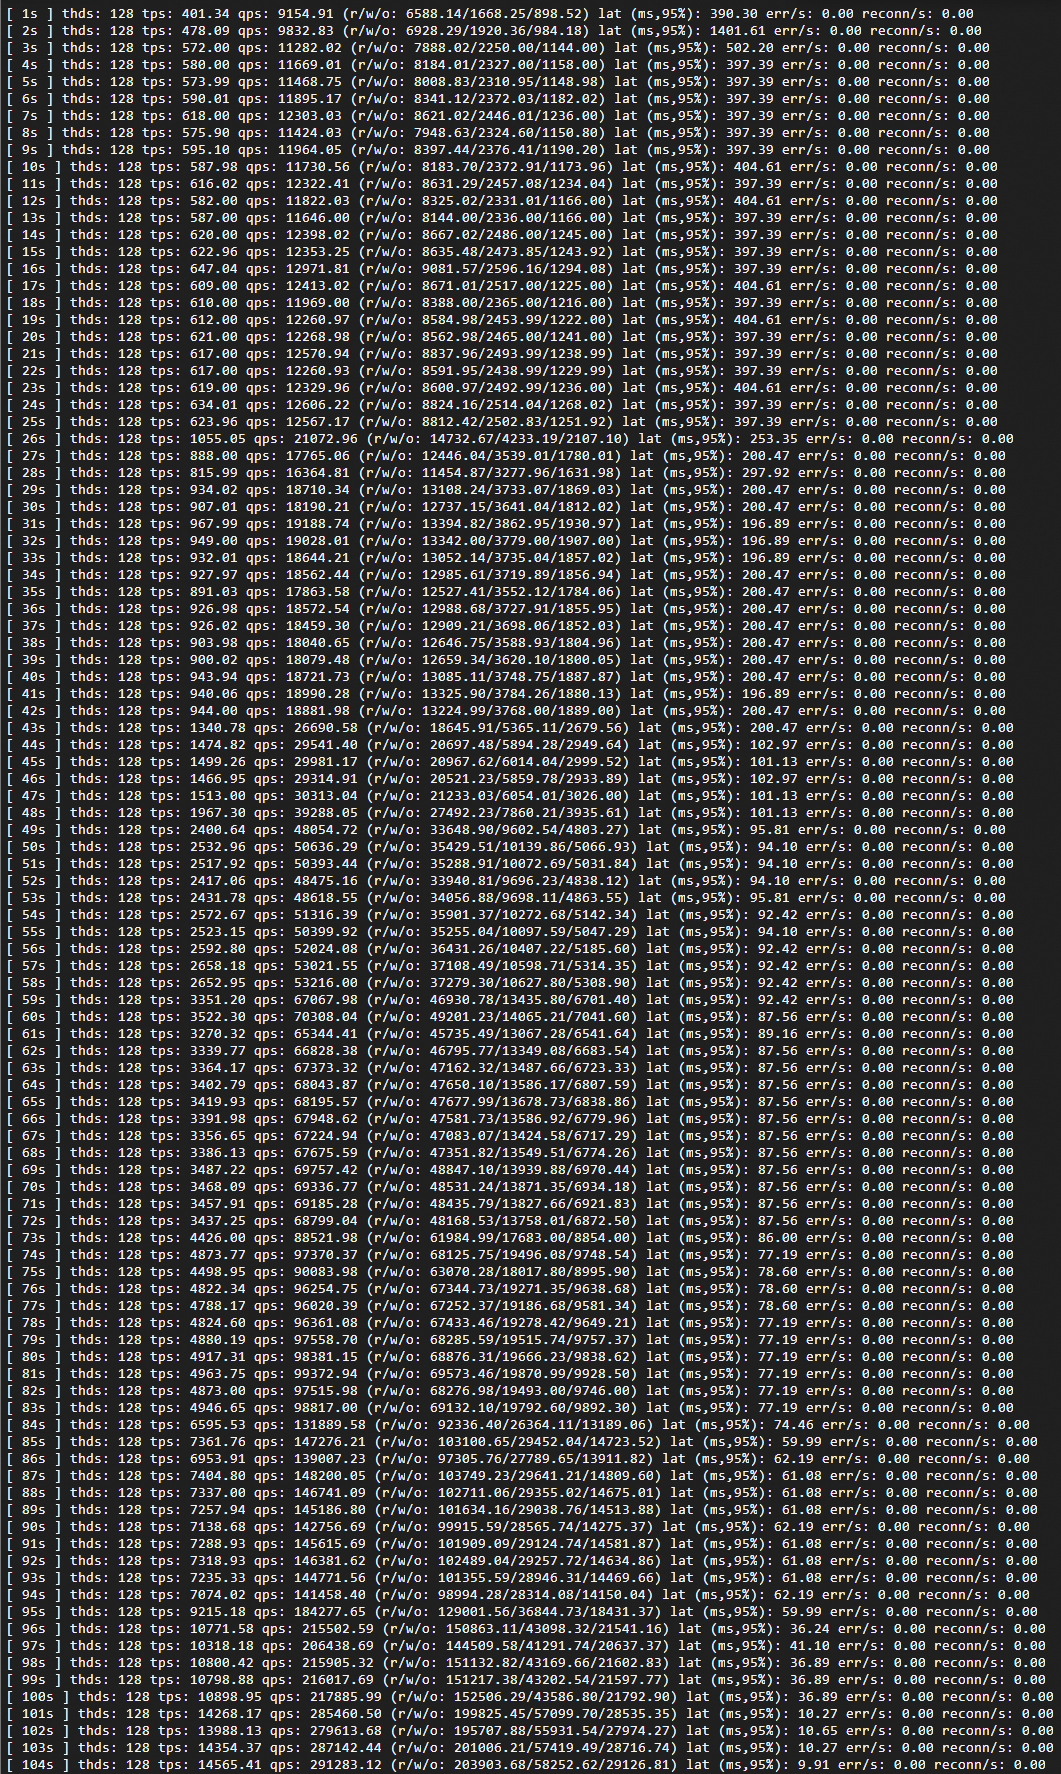
runExpected results:
TPS rises sharply and latency drops as resources expand. Both stabilize once the cluster reaches 32 PCU.
Monitor the scaling behavior:
In the Serverless Monitoring Metrics chart, adjust the time range to match your test window.
Scale-up from 1 PCU to 32 PCU takes approximately 87 seconds.
Scale-down after load stops takes approximately 231 seconds, and proceeds more gradually than scale-up.
What to look for when reading this chart:
If the cluster reaches 32 PCU and stays there throughout the test, the current single-node maximum cannot absorb the load. Enable read-only nodes to distribute the workload horizontally (see Test 2: Multi-node scale-out).
Scale-down is intentionally gradual. A slower release avoids resource thrashing if load returns shortly after it stops.
Test 2: Multi-node scale-out
This test verifies that the cluster automatically adds and removes read-only nodes based on load. Both vertical and horizontal scaling are active.
Configure Serverless settings
In the PolarDB console, go to Database Nodes on the cluster details page and set:
Maximum Resources for Single Node: 32
Minimum Resources for Single Node: 1
Maximum Read-only Nodes: 7
Minimum Read-only Nodes: 0
Run the scale-out test
Run Sysbench with 160 threads to trigger horizontal scaling:
sysbench /usr/share/sysbench/oltp_read_write.lua \
--pgsql-host=<host> \
--pgsql-port=<port> \
--pgsql-user=<user> \
--pgsql-password=<password> \
--pgsql-db=<database> \
--tables=32 \
--table-size=100000 \
--report-interval=1 \
--range_selects=1 \
--db-ps-mode=disable \
--rand-type=uniform \
--threads=160 \
--db-driver=pgsql \
--time=12000 \
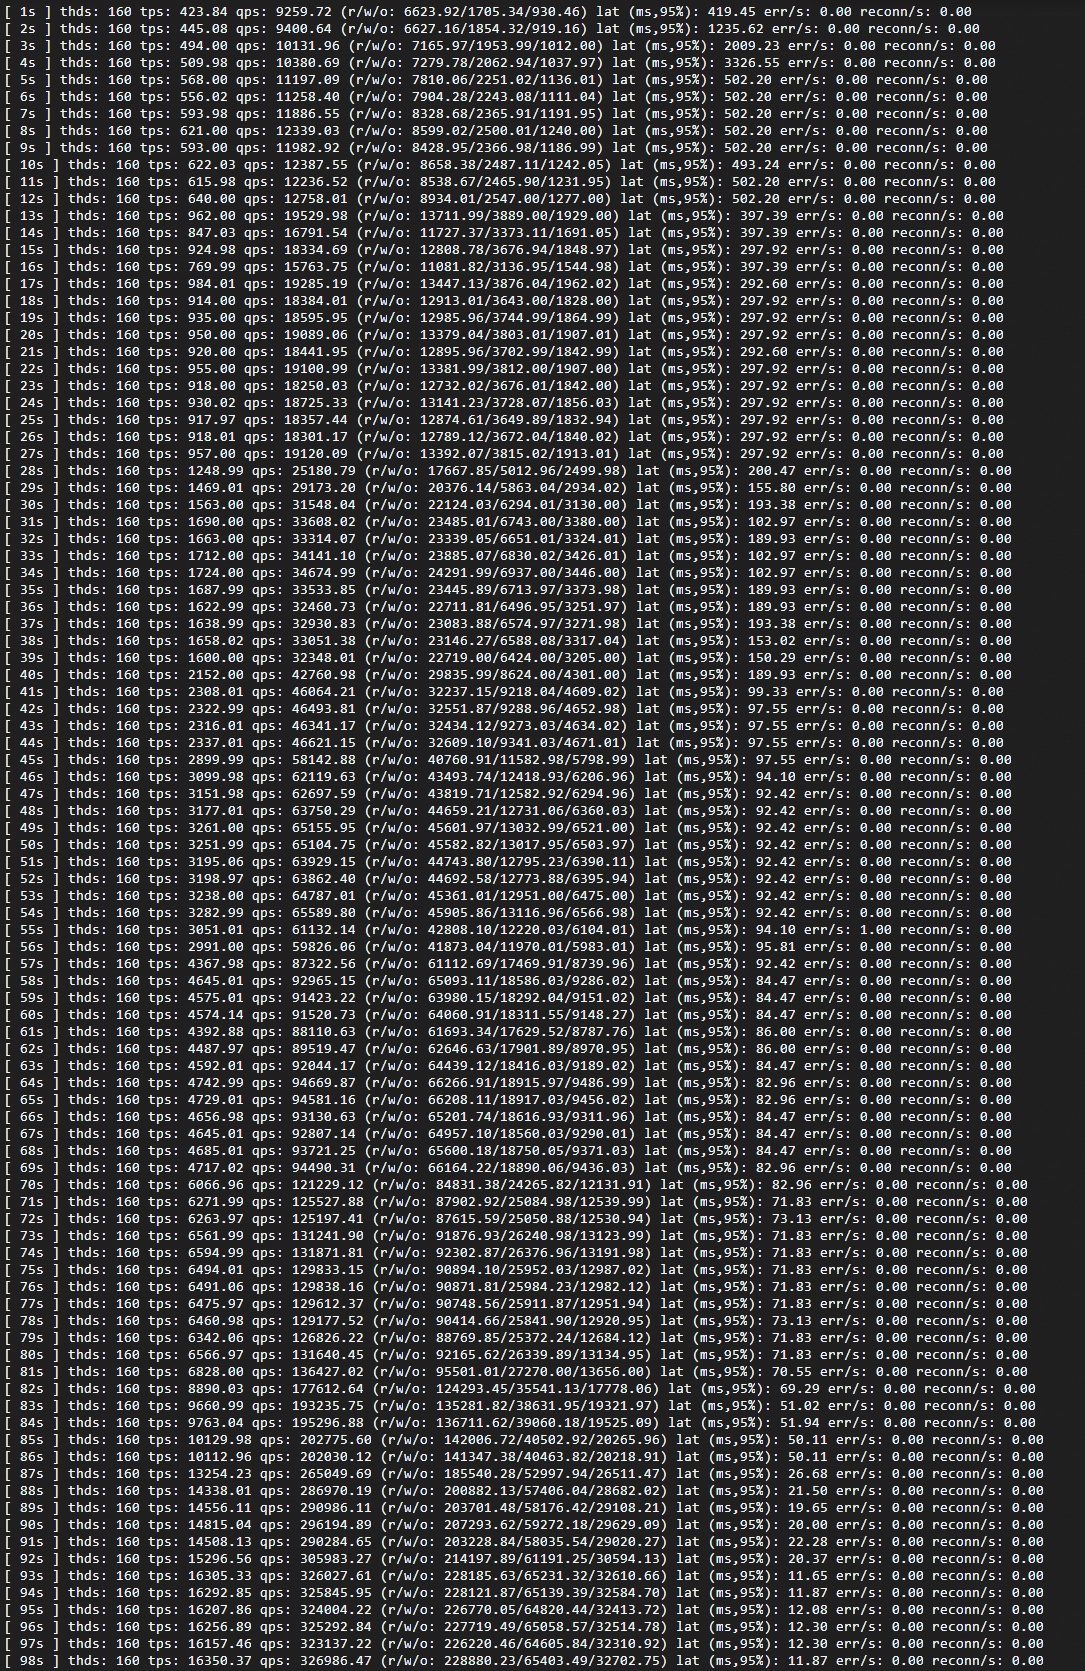
runExpected results:
Shortly after the test starts, additional read-only nodes are added to the cluster.
Once the cluster reaches a stable state, queries per second (QPS) increases from approximately 320,000 (single-node baseline) to approximately 340,000, exceeding what the single-node configuration can sustain.
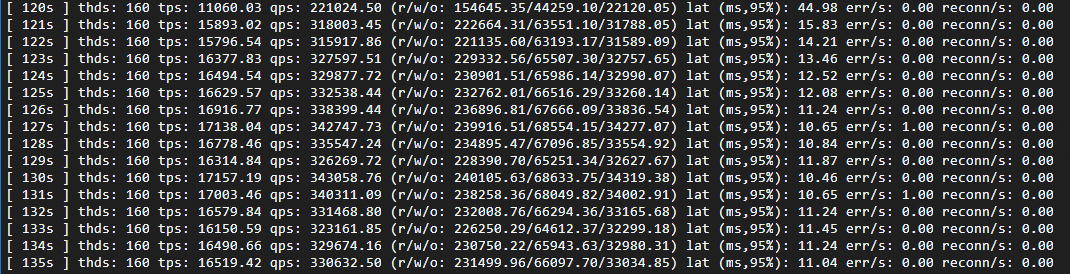
Horizontal scaling, baseline comparison, single node:
Monitor the scaling behavior:
In Serverless Monitoring Metrics, adjust the time range to your test window. The chart shows each read-only node's load curve. As nodes are added, load on existing nodes decreases until the cluster reaches a roughly balanced state.
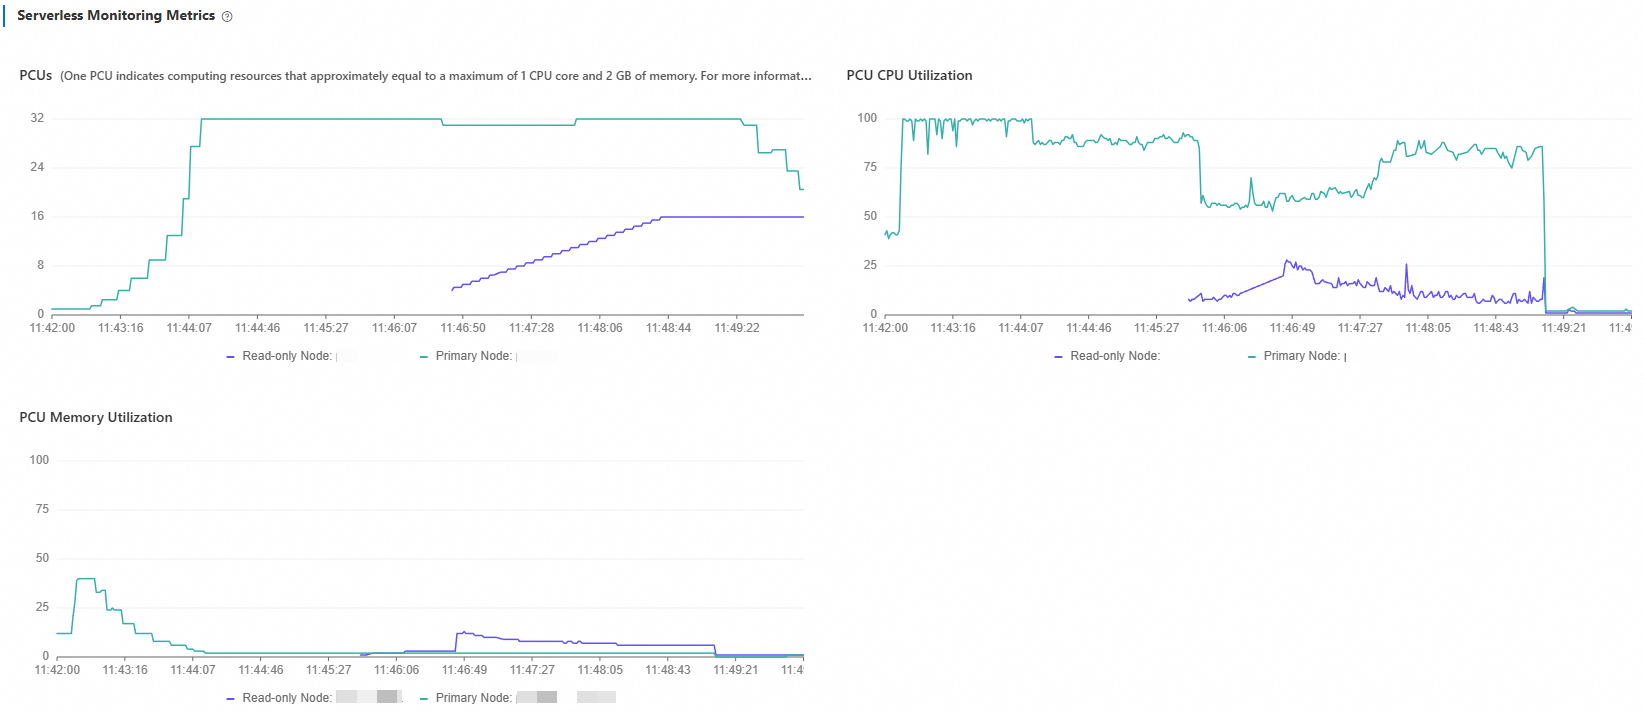
What to look for when reading this chart:
If load curves across all nodes plateau at similar values and remain high, the cluster is close to its maximum read-only node count. Increase Maximum Read-only Nodes if needed.
Uneven load curves after nodes stabilize indicate the load balancer is still redistributing connections. Allow a few minutes for the distribution to equalize.
After stopping the test:
Compute resources scale down in two stages:
PCU scale-down (2–3 minutes): Each node's PCU drops to 1. CPU utilization on read-only nodes falls immediately when load stops. The primary node continues running
vacuumbriefly before its utilization drops as well.Read-only node release (15–20 minutes): Nodes are released one by one. The delay is intentional—Serverless avoids releasing nodes immediately to prevent repeated scale-out cycles if load resumes shortly.