After you query data by using multidimensional analysis, you can save it as a report and add it to a Custom Dashboard for display and statistics.
Prepare a data table
After you purchase Quick Audience, you need to import data tables to the system before you can use your data for analysis and other operations. Before you import a table, prepare the table based on the requirements of Quick Audience Import Data Table Requirements.
Data import
After preparing the data table, choose Configuration Management> Data Import Management> Data Management, and follow the Data Import Quick Start to access the data.
Model Analysis-Multidimensional Analysis
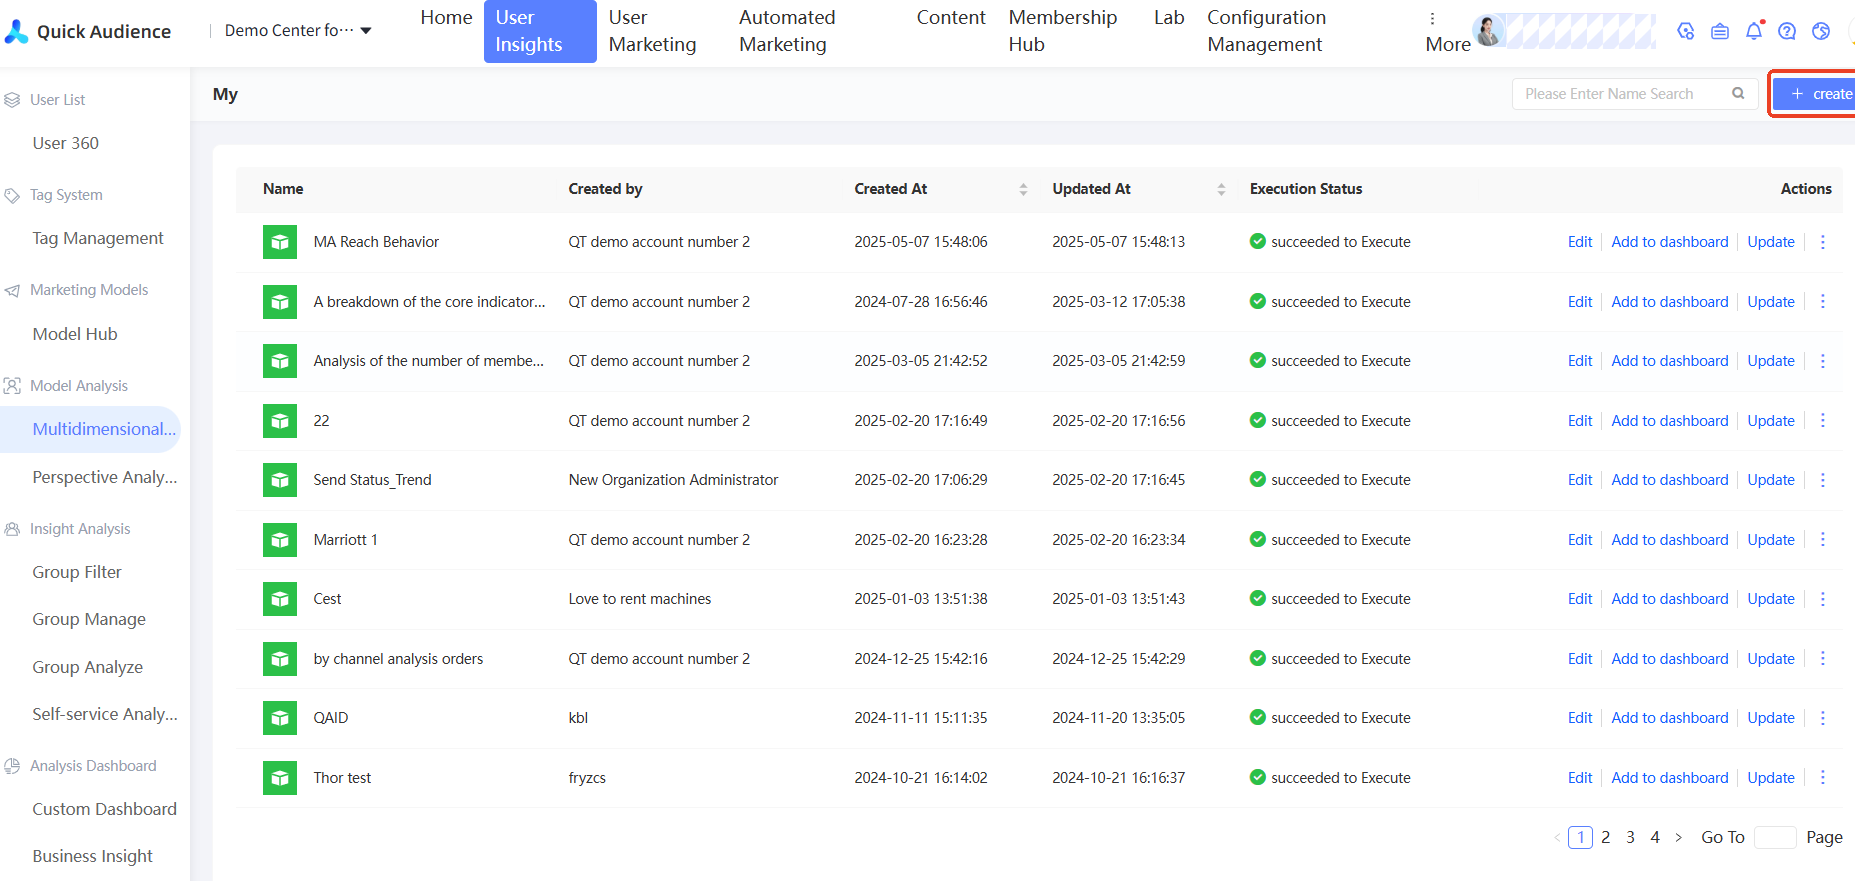
Choose User Insight> Model Analysis> Multidimensional Analysis to create an analysis model. The visualized report that is generated by the analysis is used as a component to be embedded in the custom dashboard. The procedure is as follows:
Create an analysis model
Click 「New」 in the upper right corner of the interface to create an analysis model.
Edit an analysis model
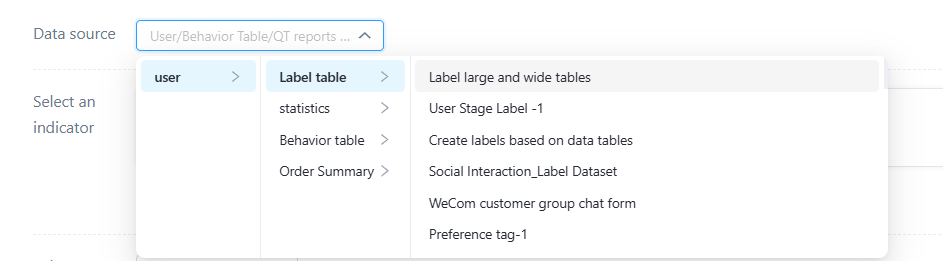
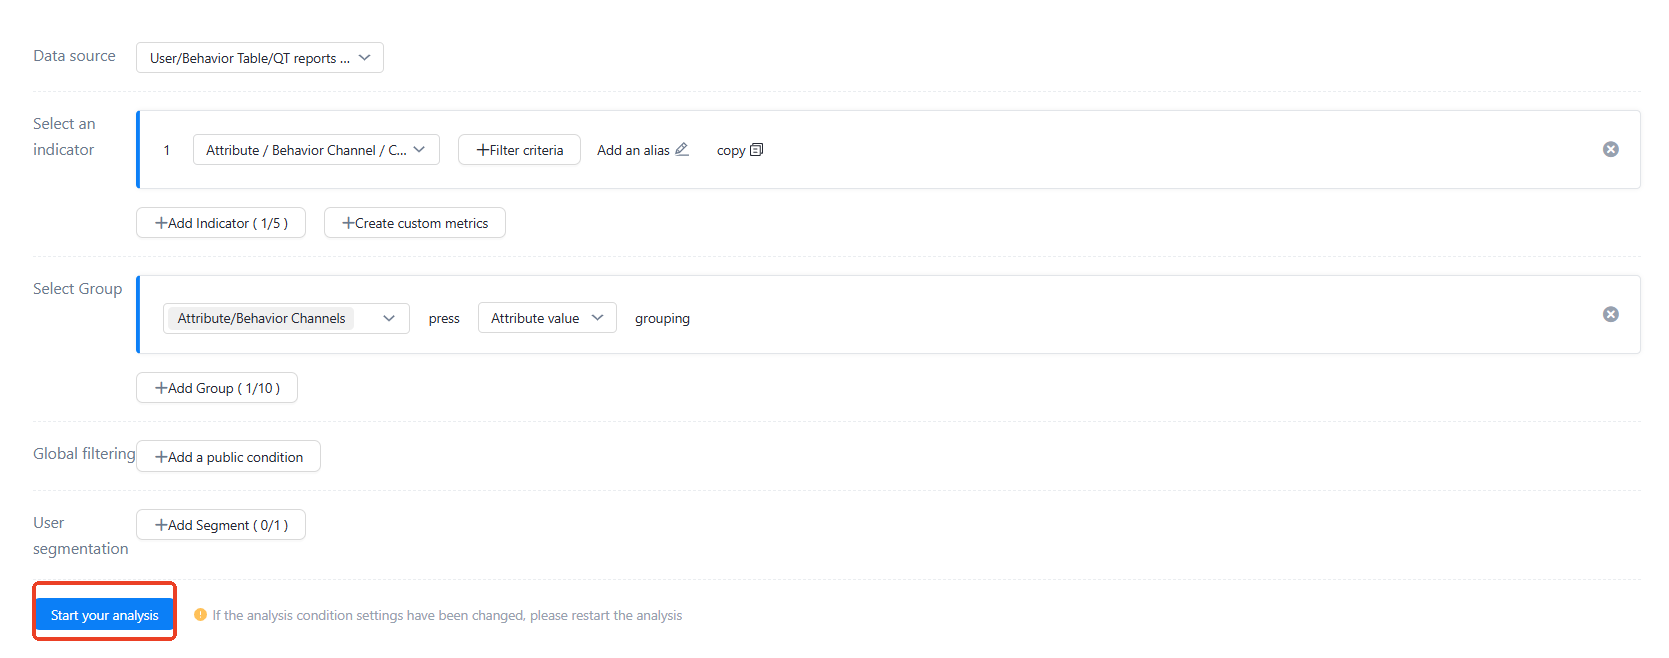
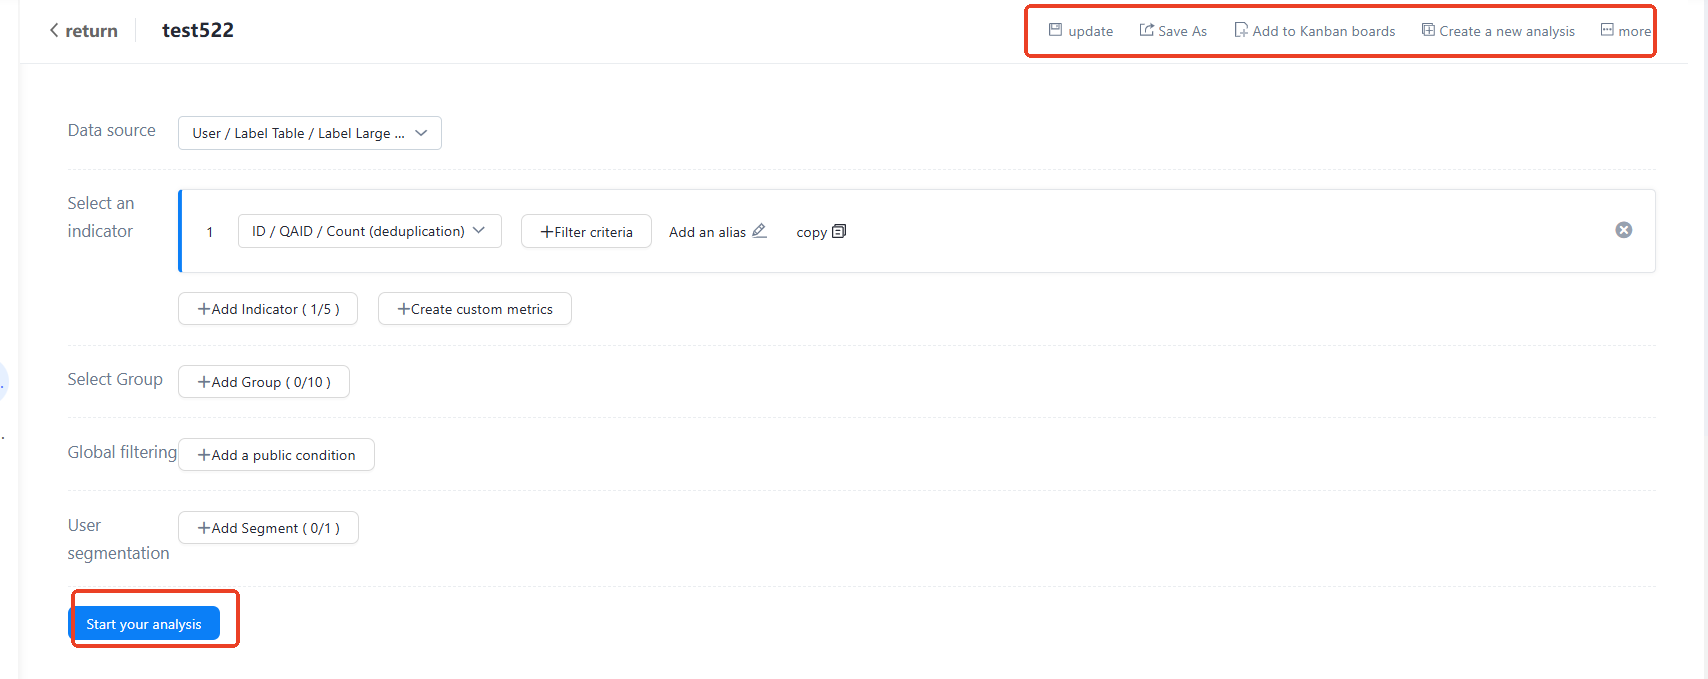
Select the data source, that is, the data table that you have imported to analyze.
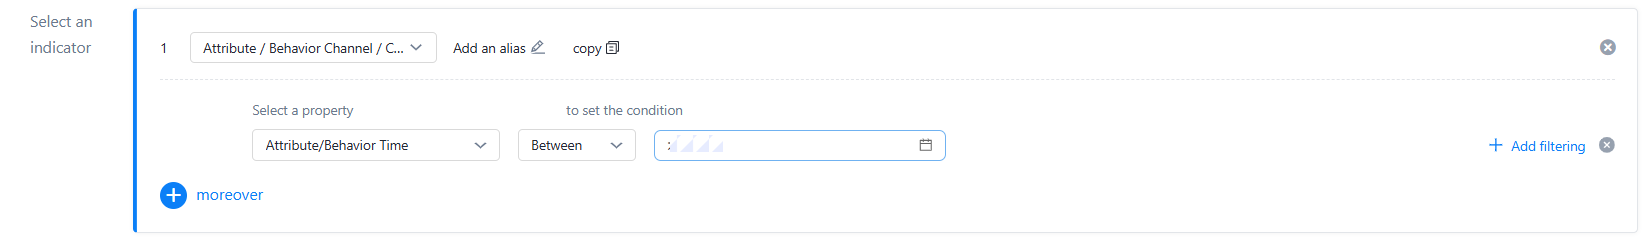
Select a metric. You can add filter conditions and alias names for the metric.
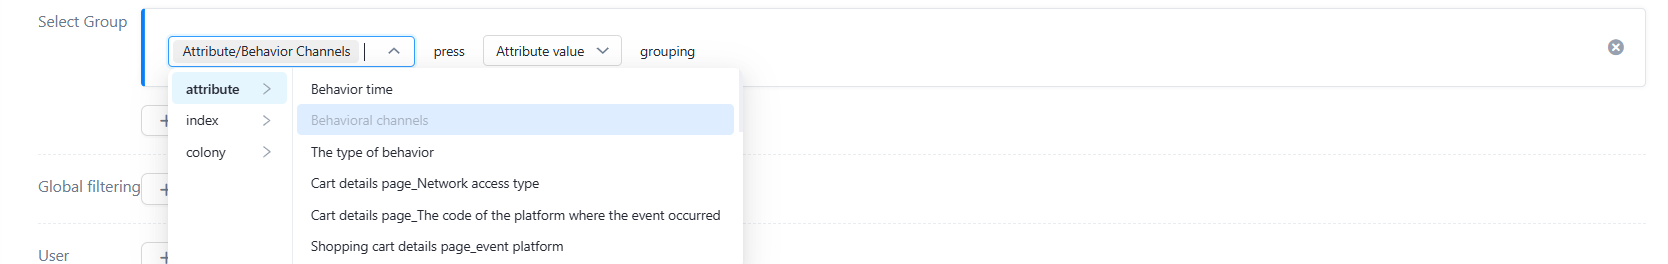
Select a group. Metrics are calculated and displayed in different groups.
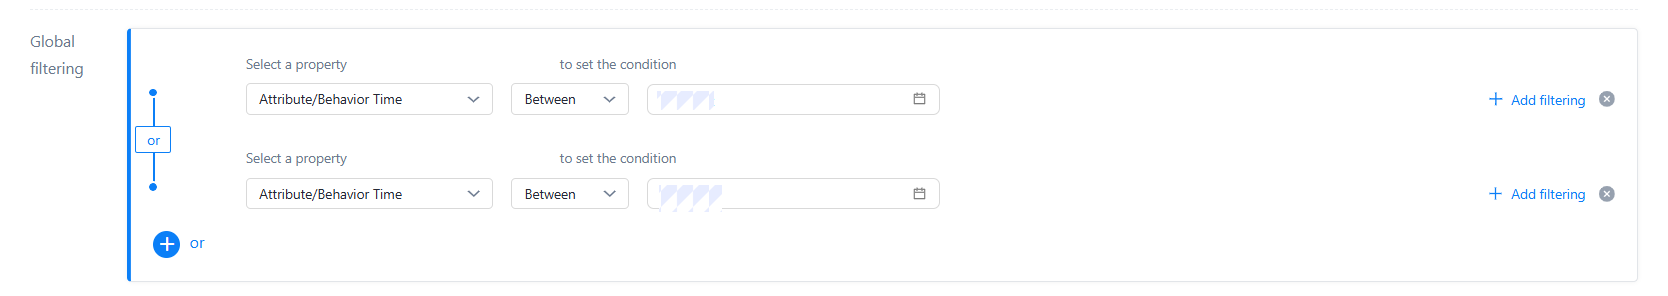
Global filtering. You can set filtering conditions.
User cohort, support adding user cohort

Model analysis and result presentation
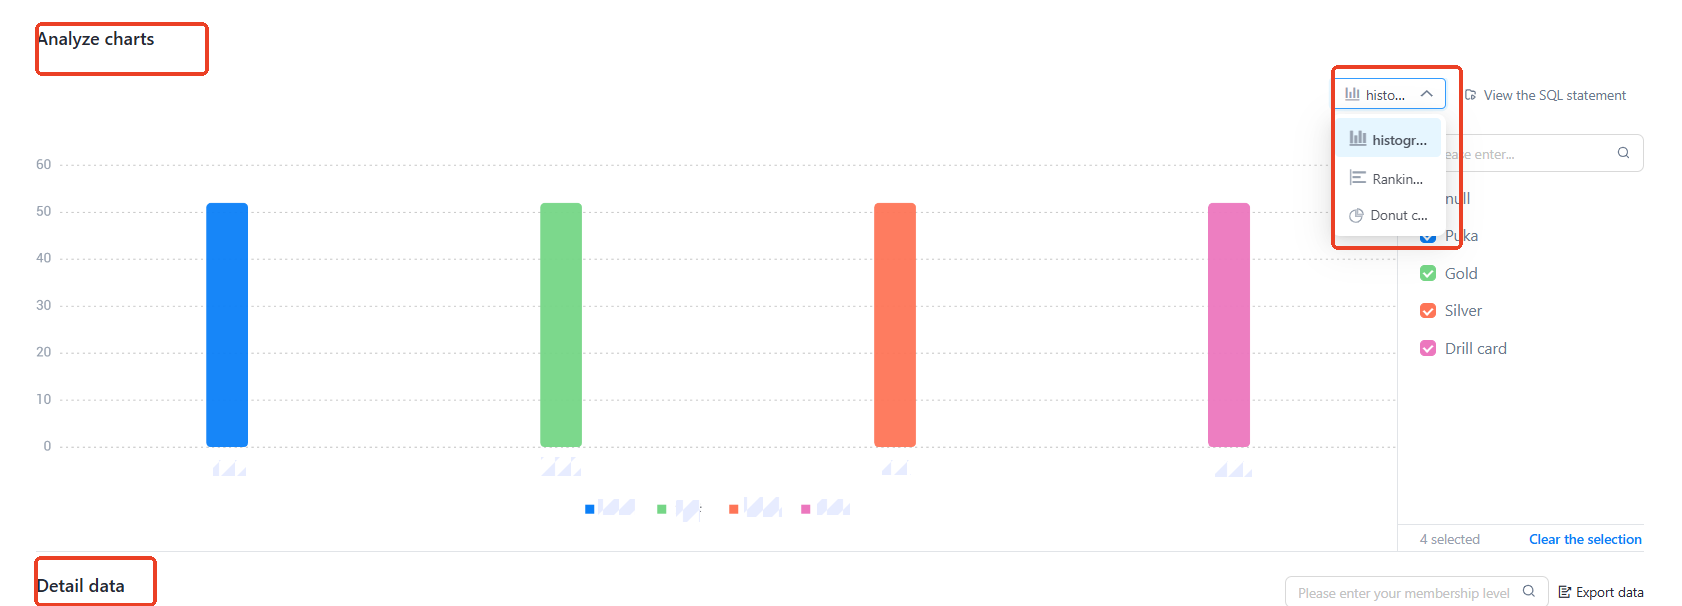
Click the 「Start Analysis」 button to see the generated analysis chart and detailed data in the analysis chart below.
You can select a chart type, such as a column chart, a row chart, or a circular chart. You can also customize a chart group.
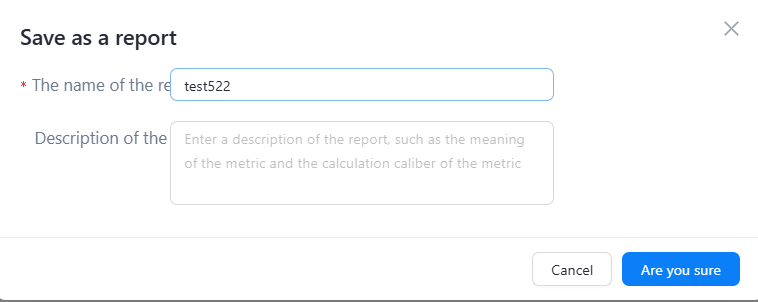
Save as Report
Click "Save" in the upper right corner of the interface to save the multi-dimensional analysis model. The generated report will be automatically added to the multi-dimensional analysis list for subsequent operations.
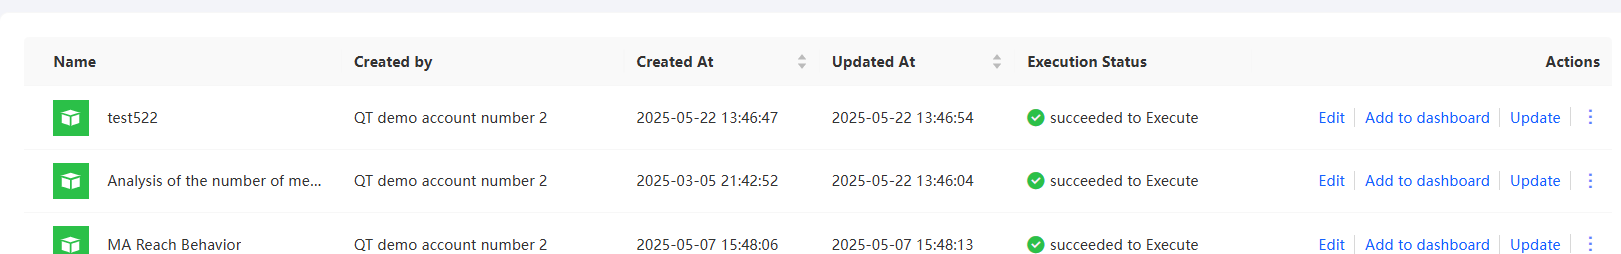
Edit Report: You can edit and modify a report. To edit a report, perform the following steps:
In the report list (multidimensional analysis list), select the report to be edited and click 「Edit」 to enter the editing page.
After editing, click 「Start Analysis」 to load the modified report.
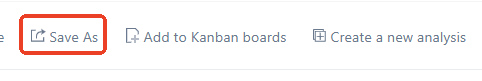
Click 「Update」 at the top right of the page to finish editing. You can also save as, add to dashboard, create a new analysis, and more.
Update Report: You can update the data of an existing report. The specific operation is as follows: in the report list (multidimensional analysis list), select the report whose data is to be updated, and click 「Update」 to update the report data.