Database Autonomy Service (DAS) provides the performance insight feature (original version). The original version provides charts and tables to help you evaluate database workloads and identify the root causes of database performance issues. This improves the stability of your databases.
Applicable scope
ApsaraDB RDS for PostgreSQL High-availability Edition
ApsaraDB RDS for PostgreSQL Cluster Edition
Data source
The original version of the performance insight feature collects data from pg_stat_activity.
The data is collected every 10 seconds.
Procedure
Log on to the DAS console.
In the left-side navigation pane, click Instance Monitoring.
On the page that appears, find the database instance that you want to manage and click the instance ID. The instance details page appears.
In the left-side navigation pane, click Performance Insight.
On the page that appears, click Enable Performance Insight. In the message that appears, click OK.
NoteIf you no longer require the performance insight feature, you can click Disable Performance Insight on the Performance Insight tab.
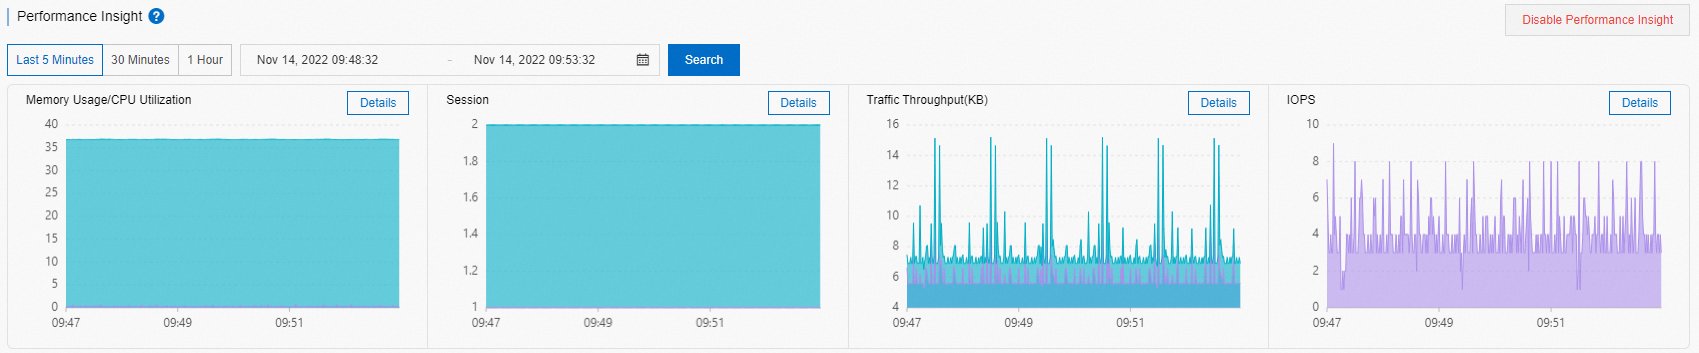
In the Performance Insight section, specify a time range, and then click Search to view the database performance metrics within the specified period.
NoteWhen you select a time range, the end time must be later than the start time.
Data generated in up to seven days within the last month are displayed in the Performance Insight section.
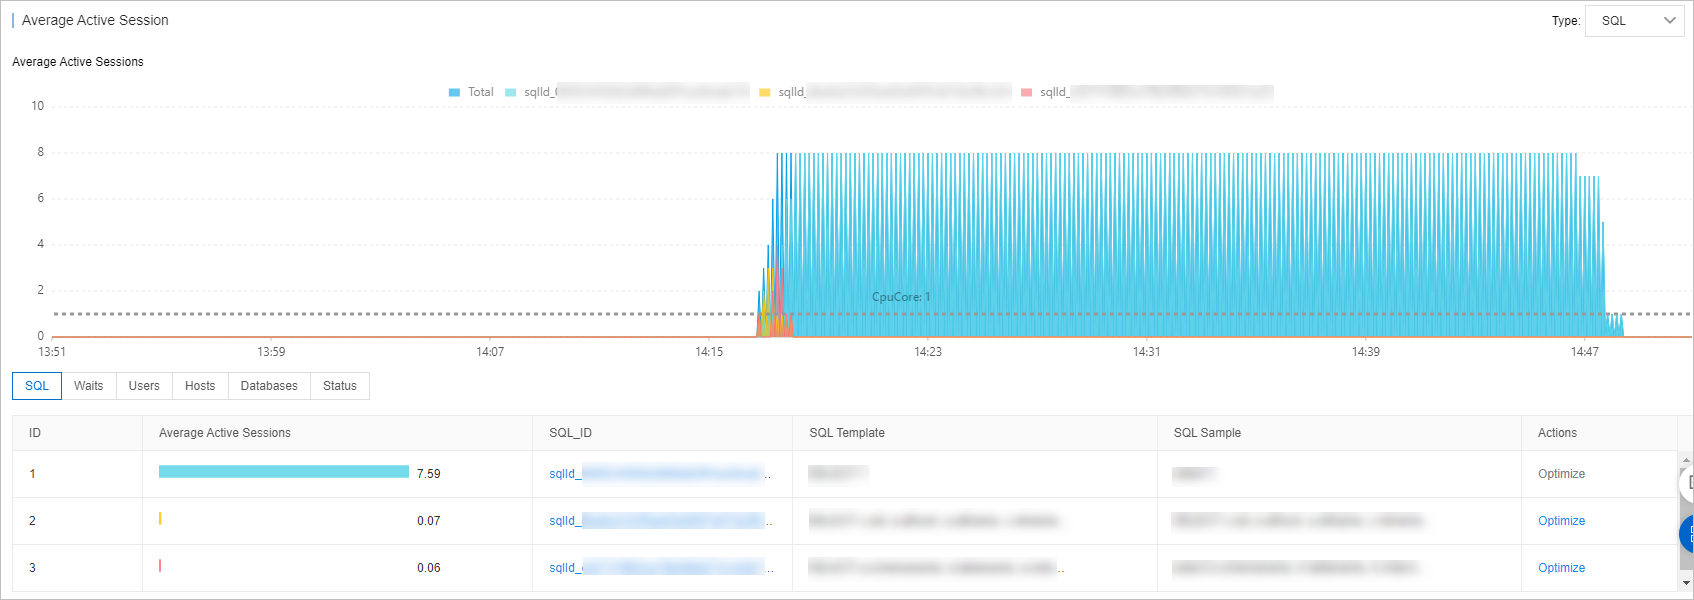
The information about sessions in the last three days is displayed in the Average Active Session section.
In the Performance Insight section, you can specify a time range to view the database performance metrics within the specified period.
You can view details of a specific performance metric. For example, if you want to view the memory usage or CPU utilization of the database instance, click Details on the right side of Memory Usage/CPU Utilization.
In the Average Active Session section, you can view the trends of different types of sessions and the database workloads from multiple dimensions. This can help you identify the root causes of performance issues.
On the SQL tab, click Optimize in the Actions column of an SQL query to enter the SQL Diagnosis Optimization page. On the SQL Diagnosis Optimization page, view the corresponding SQL statement, execution plan, and diagnosis result.