The Global Statistics page for Public Zone provides an overview of the resolution status for all domains that have network traffic analysis enabled. You can use this feature to view global resolution trends and overall performance metrics.
Use cases
-
Assess the overall health of your DNS resolution service.
-
Monitor trends in global query volume.
-
Evaluate the overall resolution success rate.
-
Analyze the distribution of global request types and resolution quality.
Procedure
-
Go to the Alibaba Cloud DNS - Statistics Dashboard.
-
Navigate to the Resolution Dashboard > Public Zone tab.
-
The Global Statistics tab is selected by default.
The top of the page contains the All Clusters drop-down list and the network traffic analysis switch. The overview section displays two metric cards: Total resolutions (Daily) and Average resolution success rate. This section also includes Set Period and Alert Notifications.
-
You can also select a different dns resolution cluster from the drop-down list in the module's upper-right corner.
Features
The Global Statistics feature collects data from domains that have network traffic analysis enabled. Ensure that network traffic analysis is enabled for at least one domain.
1. Overview
This section displays the following metrics:
|
Metric name |
Description |
|
Total resolutions in the last 24 hours |
Displays the total number of resolution requests in the last 24 hours and provides a day-over-day comparison. Use this metric to evaluate the overall load of your resolution service. |
|
Average resolution success rate in the last 24 hours |
Displays the average resolution success rate in the last 24 hours and provides a day-over-day comparison. Use this metric to evaluate the availability and stability of your resolution service. |
You can perform the following operations:
-
ClickSet Period to choose the statistical period for the overview data, such as daily, weekly, or monthly.
-
From the drop-down list in the upper-right corner of the page, select a dns resolution cluster.
-
ClickAlert Notifications to configure alert notification rules.
The page contains two tabs: Global Statistics and Domain Resolution Statistics. The upper-right corner provides a network traffic analysis switch and a Purchase Traffic Package link. A message on the page notes that global statistics are aggregated only for domains that have network traffic analysis enabled.
2. Statistics Details
This section provides data analysis in the following three categories:
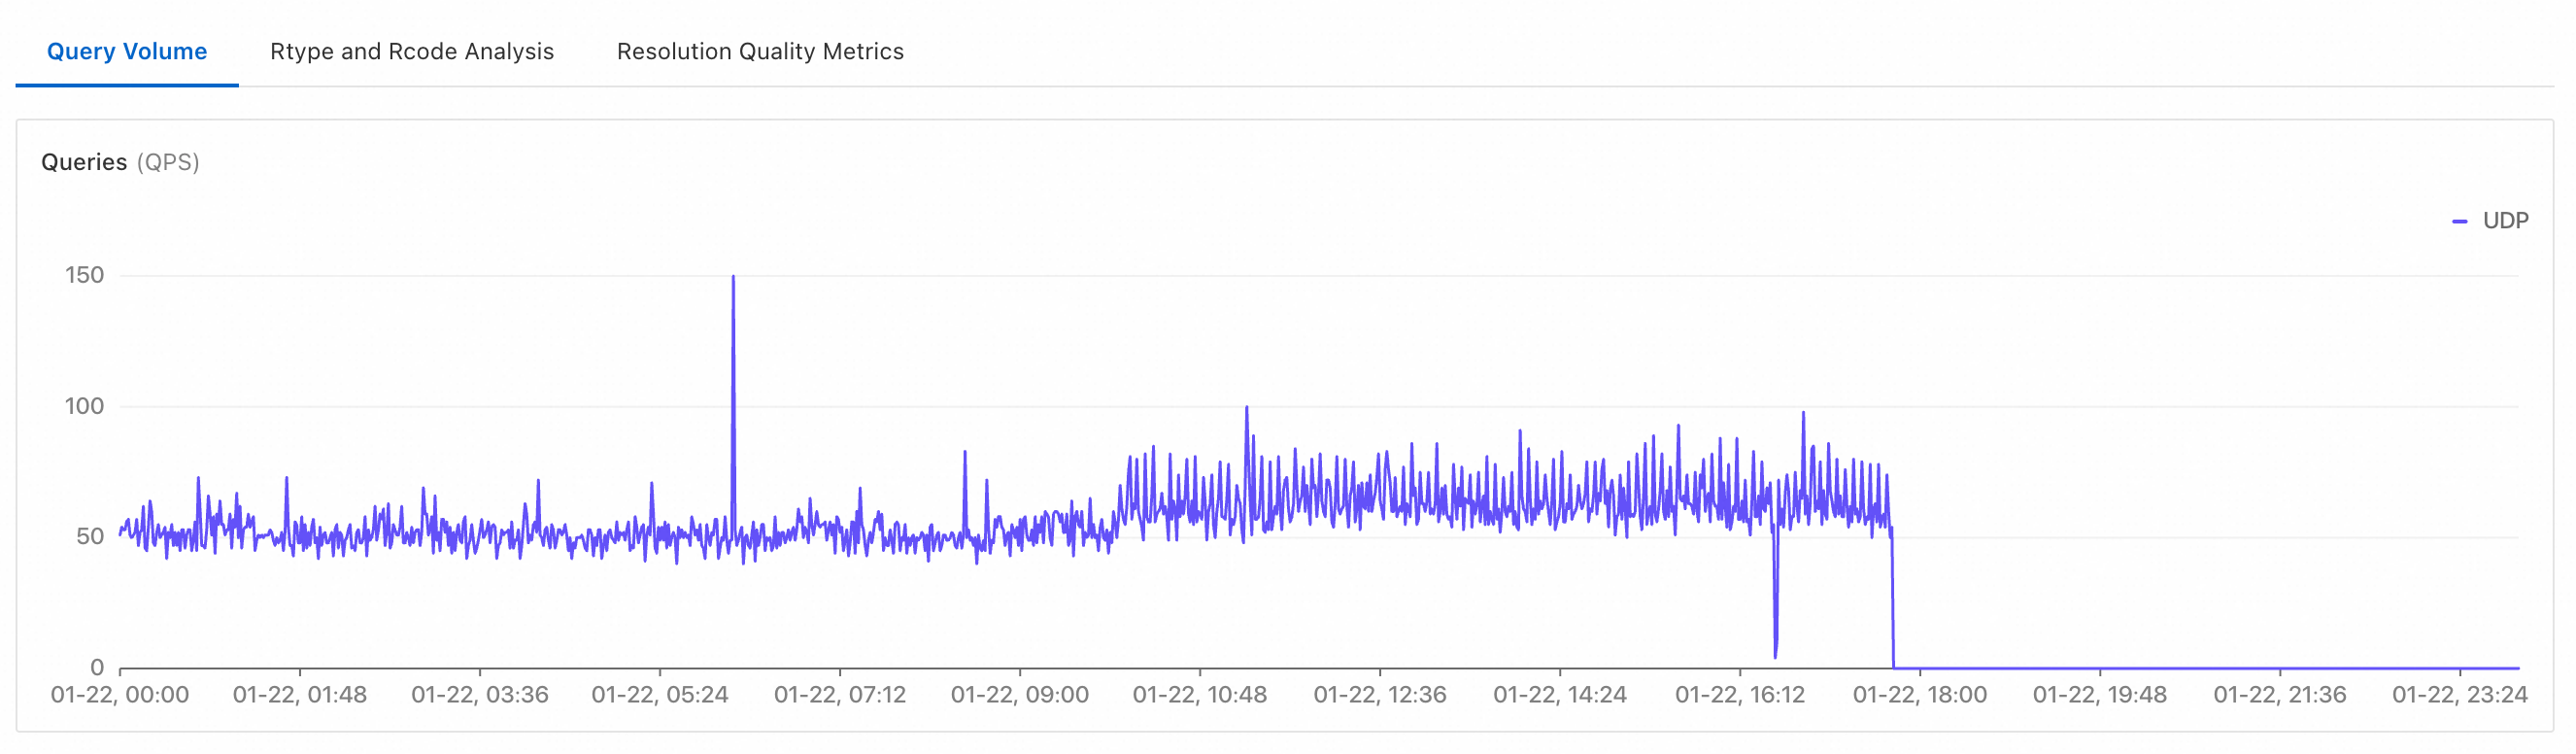
Query Volume
This section displays trend charts for query volume metrics, such as queries per second (QPS). Use these charts to analyze the time distribution and peak traffic of DNS queries.
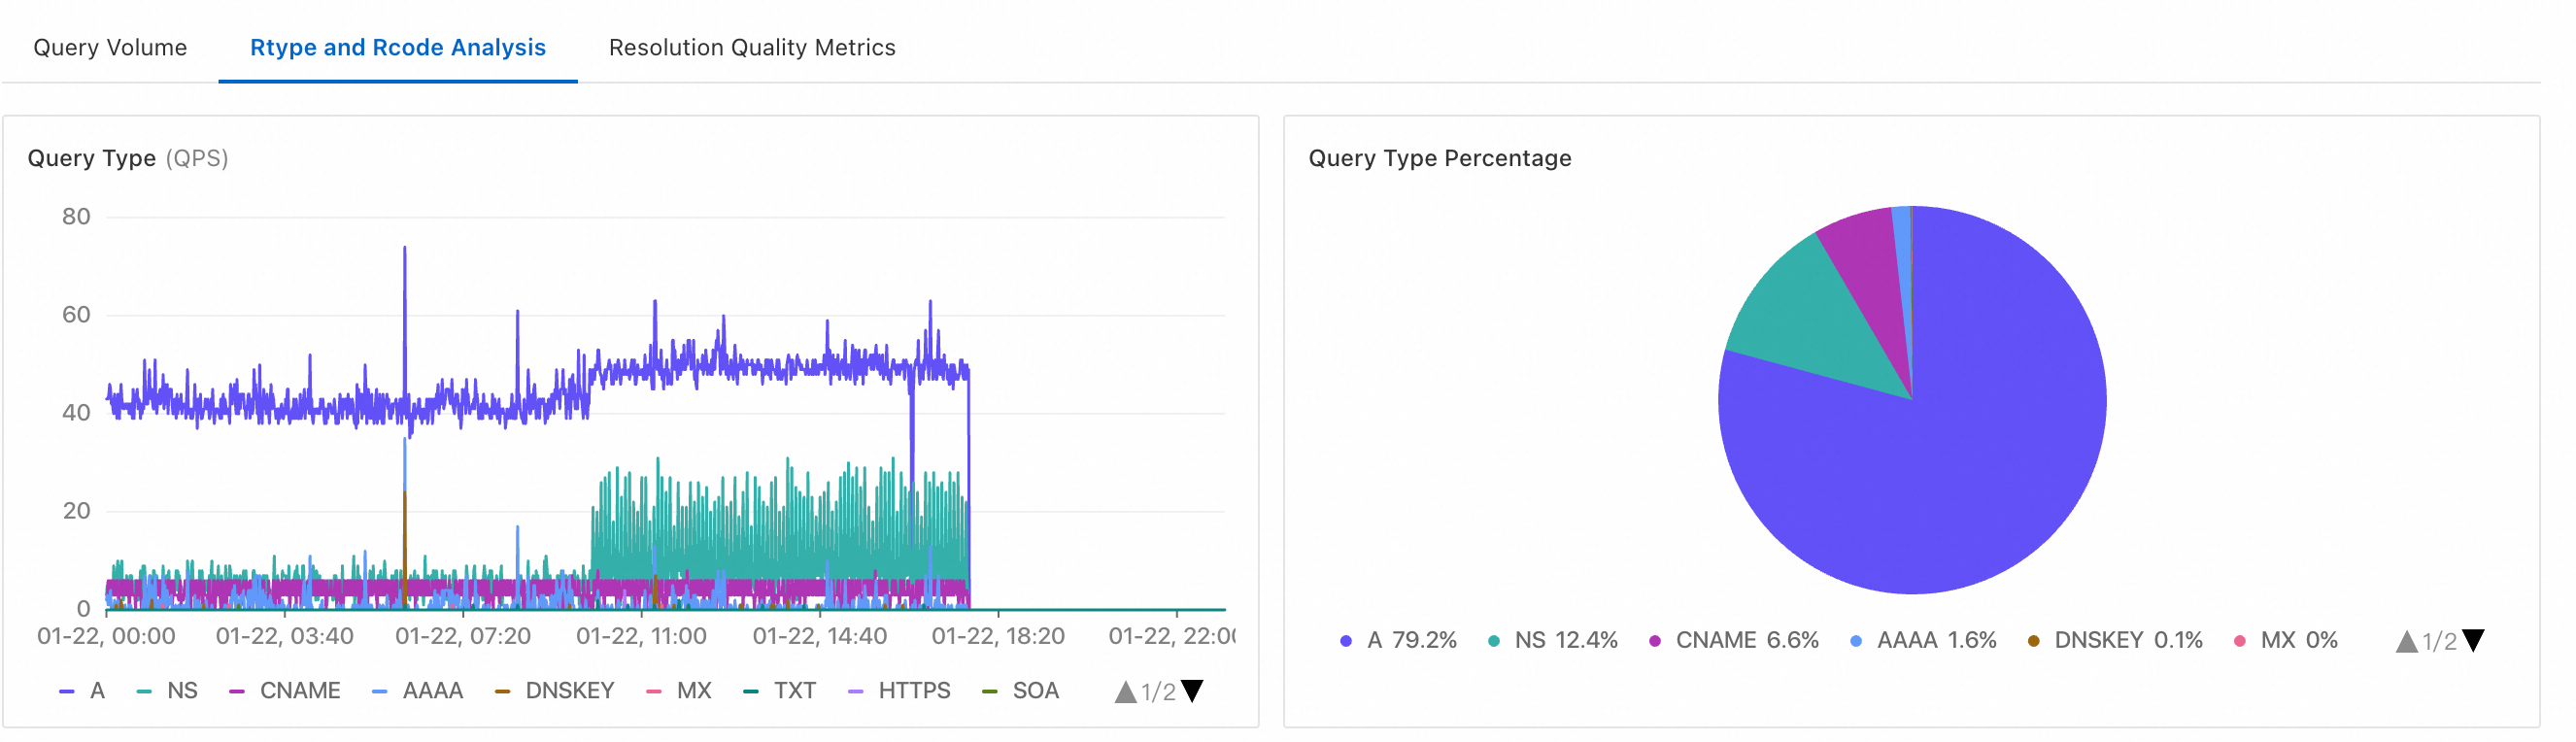
Rtype and Rcode Analysis
This section shows statistics on request and response characteristics, such as request type statistics and negative response type statistics. Use this data to analyze the composition of your DNS requests and their responses.
Request type statistics
Negative response type statistics
Type descriptions:
-
NXDOMAIN (Non-Existent Domain): The queried domain name does not exist.
-
NXRRSET: The domain name exists, but the requested record type (RRset) does not. This is also known as a NODATA scenario.
-
SERVFAIL (Server Failure): The query could not be processed because of a problem with the target DNS server.
-
REFUSED: The DNS server refuses to perform the requested operation for policy reasons.
For example, the server may not want to provide resolution to a specific requester or may not want to perform a specific operation, such as a zone transfer.
-
FORMERR (Format Error): The DNS server could not interpret the query because it was malformed.
-
NOTIMP (Not Implemented): The DNS server does not support the requested query type.
-
Click a negative response type card.
-
The table in the upper-right section aggregates data by domain name and displays the data sorted in descending order by detection count.
-
Click View in the Actions column for a domain. The table in the lower-right section then aggregates data by source address and displays the data sorted in descending order by detection count.
The Statistics Details page contains a Negative response type statistics section, which displays the percentage and detection count for NXDOMAIN and NXRRSET responses. It also includes a time-series line chart and a Negative response domains table with Domain name, Detection count, and Actions columns.
Resolution Quality Metrics
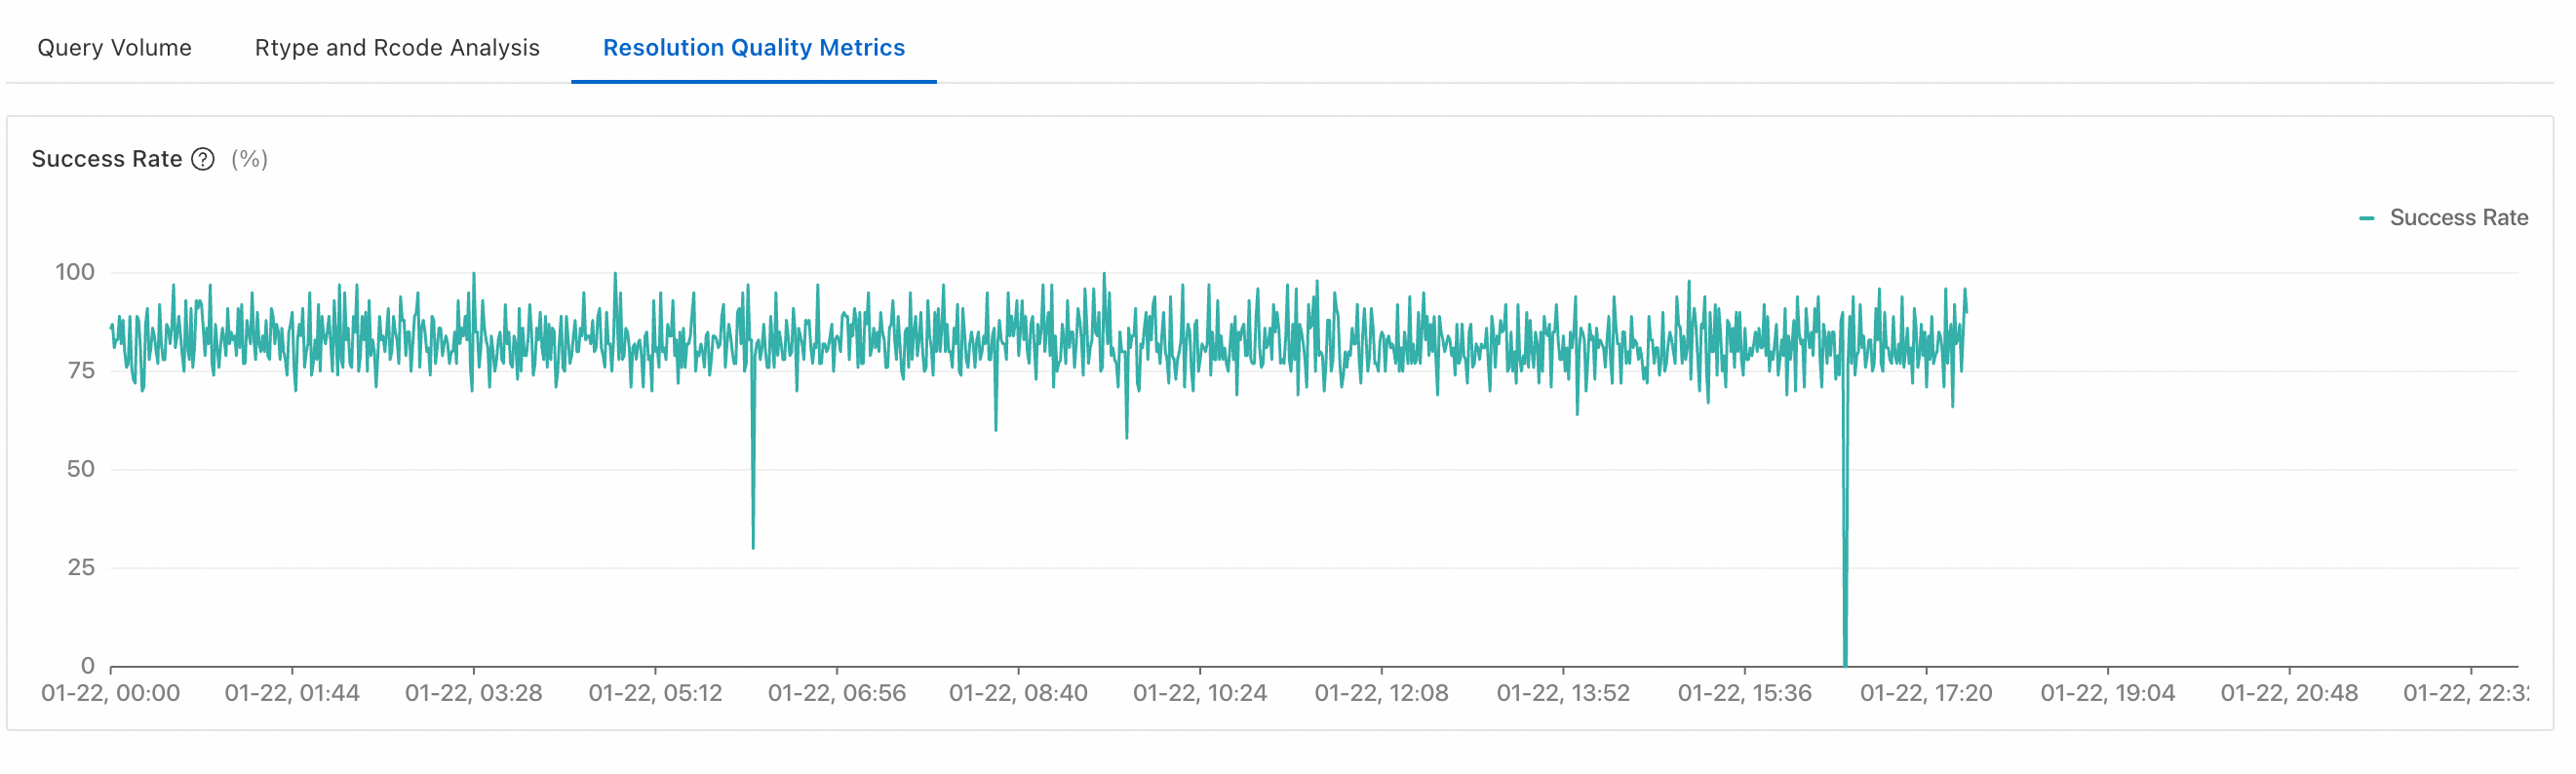
This section displays metrics and trend charts to help you evaluate the response quality and performance of your DNS service.
How the resolution success rate is calculated
resolution success rate = Number of valid responses that match the requested record type (QTYPE) / Total number of resolutions
Valid response: A response that contains resource record data that matches the requested type. For example, a request for an A record succeeds if an IPv4 address is returned. The request fails if the response is NXDOMAIN, NODATA, or any other status that does not include an A record. Similarly, a request for an AAAA record succeeds only if an IPv6 address is returned.
Recommendation: The resolution success rate measures the stability and availability of your DNS service. However, this metric can be significantly affected by invalid queries, as you cannot control the domain names and record types that clients query. For example, a client might query for randomly generated, non-existent domain names. In most cases, a stable trend line indicates normal performance. You do not need to aim for the highest possible value. Instead, use this metric as part of a comprehensive analysis.