The PromQL assistant is an intelligent assistant that is integrated with Grafana, which helps you write Prometheus Query Language (PromQL) statements. The PromQL assistant can convert the natural language into PromQL. You can use the PromQL assistant to efficiently query Prometheus data and configure alert rules with ease. This eliminates the need to read documents and learn PromQL. This topic describes how to use the PromQL assistant.
The PromQL assistant is available for all shared Grafana workspaces. If you have not activated Managed Service for Grafana, you can use a logon-free demo to use the PromQL assistant.
Demos
If you want to use PromQL for application monitoring metrics, use an application performance management (APM) data source to access Grafana without logon.
If you want to use PromQL for container metrics, use a container data source to access Grafana without logon.
Features of the PromQL assistant
Convert the natural language into PromQL
You can use the natural language to describe the Prometheus data that you want to query. The PromQL assistant can automatically retrieve the relevant metric names, Prometheus operators, PromQL statements, and corresponding descriptions.
Automatically generate PromQL comments
The PromQL assistant automatically generates annotations for PromQL statements and adds comments to PromQL statements.
Procedure
Log on to the Managed Service for Grafana console. In the left-side navigation pane, click Workspace Management.
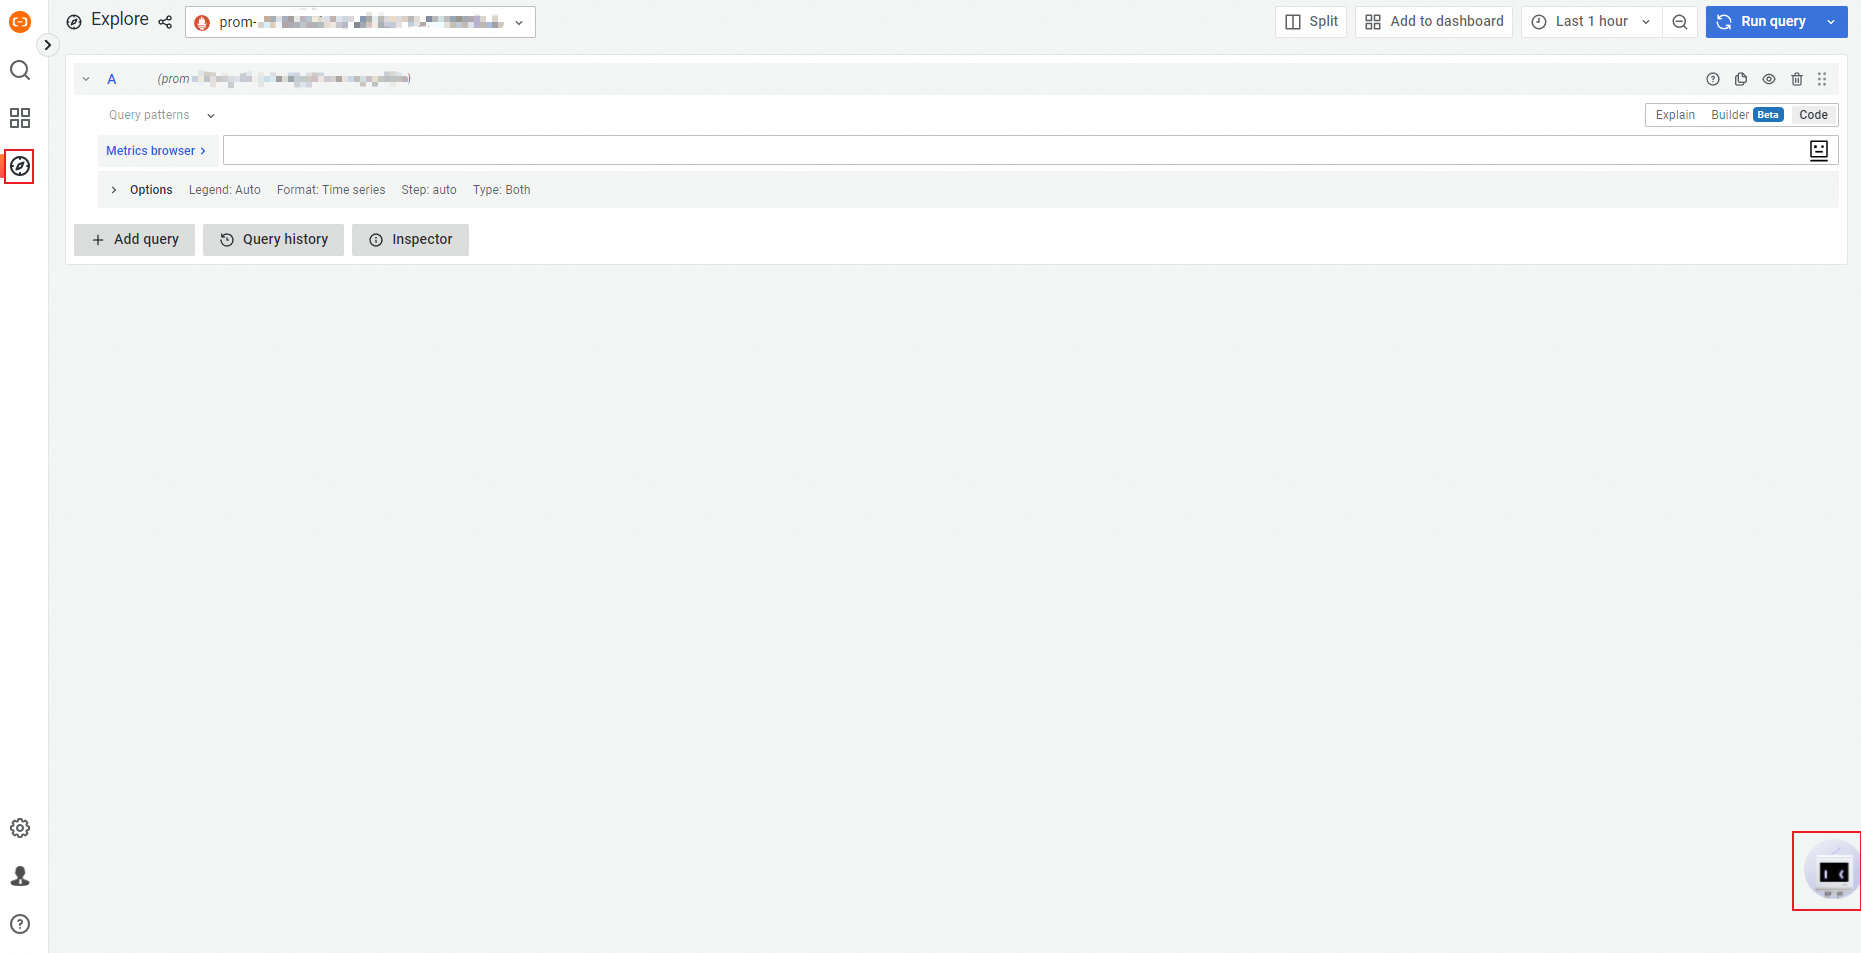
Log on to a shared Grafana dashboard and click the robot in the lower-right corner.
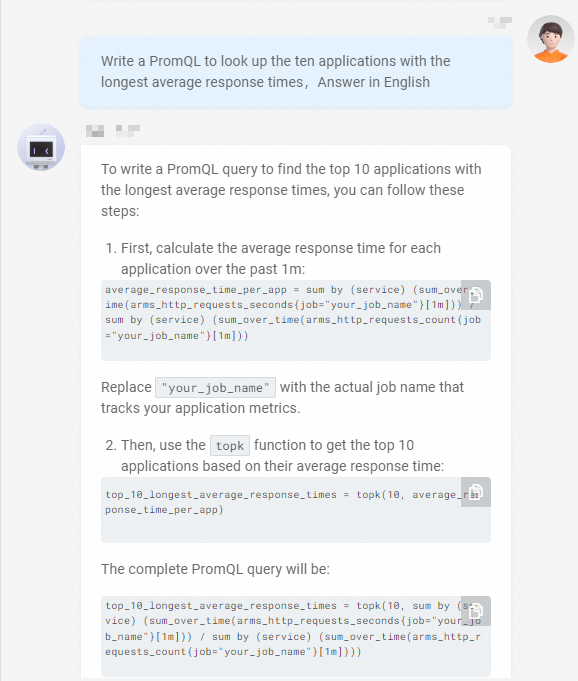
In the panel that appears, enter the description of the PromQL statements for queries as a question. For example, write PromQL statements to query the top 10 applications with the longest average response time. For more information about the description of the common PromQL statements for queries, see the PromQL scenarios and sample questions section of this topic.
ImportantMake sure that the question that you enter includes the keyword PromQL.
 Note
NoteThe PromQL assistant returns results in English only if you enter questions in English.
Click Send. Wait a few seconds until the PromQL assistant returns PromQL statements based on your question.
NoteIf you are not satisfied with the answer provided by the PromQL assistant, click Submit Text2 PromQL Feedback.
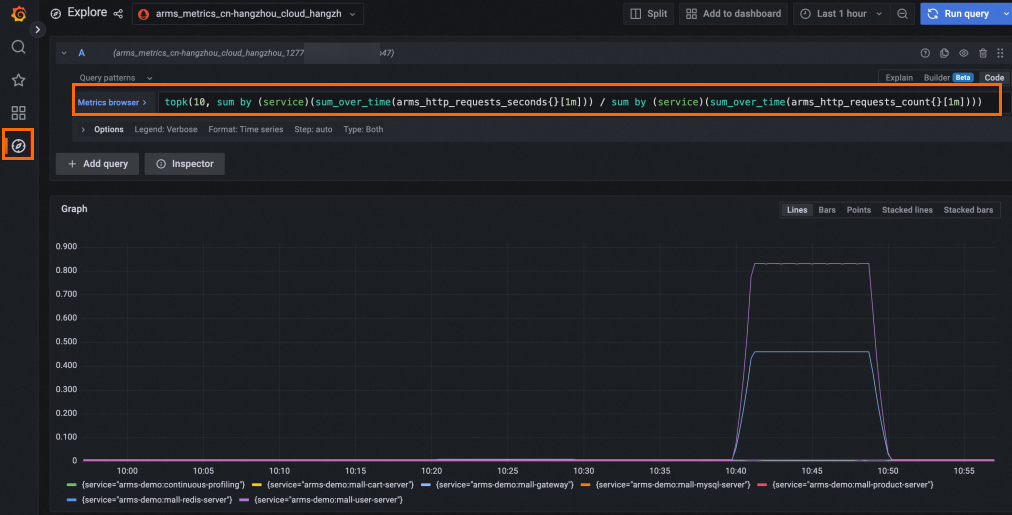
After you receive the PromQL statements, paste the PromQL statements to Explore in Grafana. Make sure that the data source of the dashboard contains the metrics that you want to query.
Video tutorial
The following video provides an example on how to use the PromQL assistant.
Q&A scenarios supported by Text2 PromQL
Text2 PromQL supports more than 20 common PromQL statement generation scenarios. For more information, see the PromQL scenarios and sample questions section of this topic. You can click PromQL to view the supported scenarios and sample questions.
When you click on the PromQL widget, the PromQL Assistant returns supported scenarios for generating common PromQL statements.
PromQL scenarios and sample questions
This section describes some metrics commonly used in container services and Application Real-Time Monitoring Service (ARMS) and provides examples on the description of the PromQL statements for queries.
Container service-related metrics
We recommend that you use Grafana dashboards that are monitored by Prometheus instances for Container Service. For more information, see Create a Prometheus instance to monitor an ACK cluster.
Scenario | Sample question that includes the keyword PromQL |
Queries related to node resources | Q: Write PromQL statements to query the CPU utilization of each Kubernetes node. Q: Write PromQL statements to query the memory usage of the following Kubernetes node: 172.16.xx.xx:9100. Q: Write PromQL statements to trigger alerts if a node becomes abnormal in the current cluster. Q: Write PromQL statements to query abnormal nodes. |
Queries related to pod resources | Q: Write PromQL statements to trigger alerts if a pod is restarted more than twice within 5 minutes. Q: Write PromQL statements to query the availability of the following pod:
Q: Write PromQL statements to query the pod that has the most exceptions in a Kubernetes cluster. Q: Write PromQL statements to query the failed jobs. |
Queries related to container resources | Q: Write PromQL statements to query the container with the highest CPU utilization in the default namespace. Q: Write PromQL statements to query the memory usage of each container in the following namespace and pod: Q: Write PromQL statements to query the top five containers with the highest memory usage. |
Queries related to metrics on the Lingjun dashboard | Q: Write PromQL statements to query the GPU utilization of each node on the Lingjun dashboard. Q: Write PromQL statements to query the GPU utilization of each cluster on the Lingjun dashboard. |
ARMS-related metrics
We recommend that you use PromQL statements to query data on the Grafana dashboards generated by ARMS by default for application performance monitoring.
Scenario | Sample question that includes the keyword PromQL |
Queries related to the average response time | Q: Write PromQL statements to query the average response time of each API operation. Q: Write PromQL statements to query the average response time of each API operation in Application A. Q: Write PromQL statements to query the top 10 API operations with the longest average response time in Application A. Q: Write PromQL statements to query the top 10 applications with the longest average response time. |
Queries related to error rates | Q: Write PromQL statements to query the error rate of each API operation in Application A in the previous minute. Q: Write PromQL statements to query the top 10 applications with the highest error rate in ARMS. Q: Write PromQL statements to query the top 10 API operations with the highest error rate in Application A. Q: Write PromQL statements to query the top five API operations with the highest error rate on the machine (IP address: 195.128.xx.xx) of Application A in the previous 2 hours. |
Queries related to the number of calls | Q: Write PromQL statements to query the queries per second (QPS) of a Redis database. Q: Write PromQL statements to query the QPS of the Dubbo service. Q: Write PromQL statements to query the QPS of each API operation in Application A. Q: Write PromQL statements to query the number of API calls for each application in the previous hour and group the calls by machine. Q: Write PromQL statements to query the number of calls to each API operation of Application A in the previous 5 minutes in ARMS. Q: Write PromQL statements to query the number of calls to the API operations with the payment/coupon tag in Application A in the previous 5 minutes. Q: Write PromQL statements to query the top 10 API operations with the largest number of calls. Q: Write PromQL statements to query the top five API operations with the largest number of calls in Application A. |
Queries related to the number of errors | Q: Write PromQL statements to query the number of errors for each API operation in the previous 5 minutes. Q: Write PromQL statements to query the total number of HTTP request errors on the machine whose IP address is 10.26.xx.xx in the previous 5 minutes. Q: Write PromQL statements to query the API operation with the largest number of errors in the previous hour. Q: Write PromQL statements to query the total number of call errors that occurred on the machine whose IP address is 10.26.xx.xx and on which the ClothService service is deployed in the previous 10 minutes. |
Queries related to slow SQL queries | Q: Write PromQL statements to query the slow SQL queries generated in the previous 10 minutes. Q: Write PromQL statements to query the API operation that causes the largest number of slow SQL queries in Application A in the previous 10 minutes. Q: Write PromQL statements to query the top 10 API operations that cause the largest number of slow SQL queries in Application A. Q: Write PromQL statements to query the slow SQL queries generated in the previous hour. |
Queries related to databases | Q: Write PromQL statements to query the API operations that failed to be called on a Redis database in the previous minute. Q: Write PromQL statements to query the top five API operations that failed to be called on a MySQL database in the previous minute. |
Queries related to HTTP status codes | Q: Write PromQL statements to count the number of 4xx or 5xx errors. Q: Write PromQL statements to count the number of 400 and 500 errors. Q: Write PromQL statements to query the number of requests for which 4xx is returned for Application A. |
Queries related to full garbage collections (GCs) on Java virtual machines (JVMs) | Q: Write PromQL statements to query the number of full GCs occurred in the previous day. Q: Write PromQL statements to query the number of full GCs occurred on each machine in the previous hour. Q: Write PromQL statements to query the machines on which full GCs occurred in Application A. Q: Write PromQL statements to query the machines on which full GCs occurred more than five times. |
Queries related to the amount of time consumed by full GCs on JVMs | Q: Write PromQL statements to query the amount of time consumed by full GCs on each machine. Q: Write PromQL statements to query the top five machines on which full GCs consume the largest amount of time. Q: Write PromQL statements to query the services in which full GCs consume more than 1 second. |
Queries related to QPS increase | Q: Write PromQL statements to query the applications whose number of access requests increases within 10 minutes. Q: Write PromQL statements to query the application whose number of access requests most increases in the previous day. Q: Write PromQL statements to query the API operation whose number of access requests most rapidly increases in Application A in the previous week. |
Queries related to incremental metrics | Q: Write PromQL statements to monitor the Q: Write PromQL statements to monitor the increment of the |
Queries related to the number of errors in the ARMS console | Q: Write PromQL statements to check whether the number of errors increases or decreases compared with that of yesterday. |
Queries related to the number of requests in the ARMS console | Q: Write PromQL statements to query the number of requests that increases or decreases compared with that of the previous hour. |
Queries related to the number of exceptions in the ARMS console | Q: Write PromQL statements to check whether the number of exceptions increases or decreases compared with that of yesterday. |
Queries related to the average amount of time consumed in the ARMS console | Q: Write PromQL statements to check whether the average amount of time consumed by applications increases or decreases compared with that of the previous hour. Q: Write PromQL statements to query the increased or decreased average amount of time consumed by applications. |
Queries related to full GCs in the ARMS console | Q: Write PromQL statements to query the applications that are affected by full GCs. Q: Write PromQL statements to query the API operations that are affected by full GCs. |
Queries related to slow SQL queries in the ARMS console | Q: Write PromQL statements to query the applications that involve slow SQL queries. Q: Write PromQL statements to query the API operations that cause slow SQL queries. |
Queries related to new exceptions or errors | Q: Write PromQL statements to query the applications whose number of errors increases. Q: Write PromQL statements to query the machines whose number of errors increases. Q: Write PromQL statements to query the API operations whose number of errors increases in Application A. |
Queries related to CPU utilization | Q: Write PromQL statements to query the CPU utilization of each machine. Q: Write PromQL statements to query the top five machines with the highest CPU utilization in the previous 5 minutes. Q: Write PromQL statements to query the machines whose CPU utilization exceeds 70% in Application A in the previous 5 minutes. Q: Write PromQL statements to query the top five machines whose CPU utilization most rapidly increases in the previous 5 minutes and list the CPU utilization. |